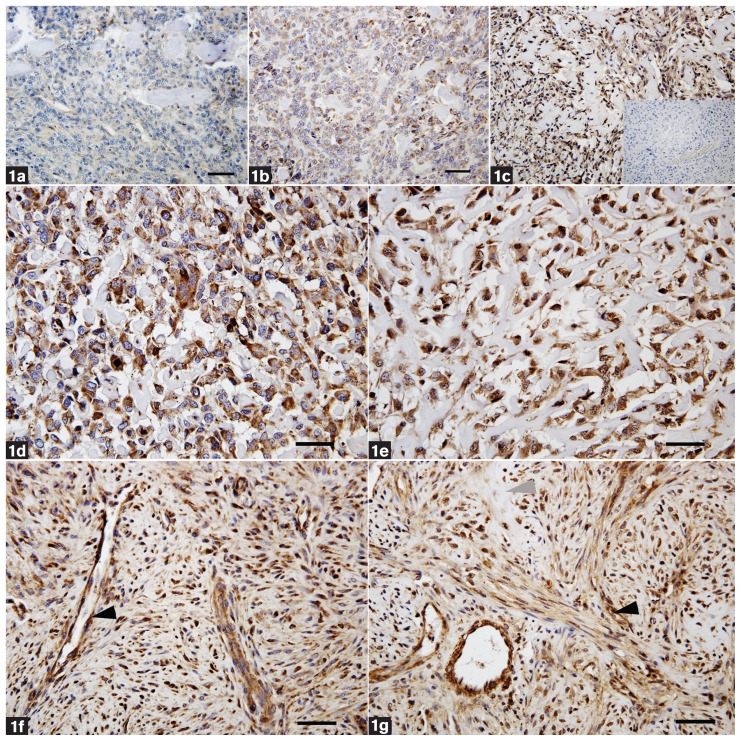
Figure 1.
Distribution of the different immunostaining levels scored from 1 to 3 (1 = mild, 2 = moderate, 3 = marked) (a to c). Mild staining intensity (a), moderate staining intensity (b), and marked staining intensity (c), including the negative control for MMP9 (inset). Canine osteoblastic OS (case no. 6) with marked staining intensity for MMP2 (d) and MMP9 (e) were scored as IPS III. Typical osteoblast-like cells producing osteoid matrix are shown. Feline osteoblastic OS (case no. 21) with marked staining intensity for MMP2 (f) and MMP9 (g) were scored as IPS III. The latter 2 panels show a heterogeneous cell pattern indicating whirl formation of spindle-shaped cells. Note also the intense staining of tumor cells and blood vessels, particularly in the area of tumor cell whorls (black arrowhead). Area of osteoid matrix surrounded by tumor cells is marked (grey arrowhead). Bar = 50 μm.

