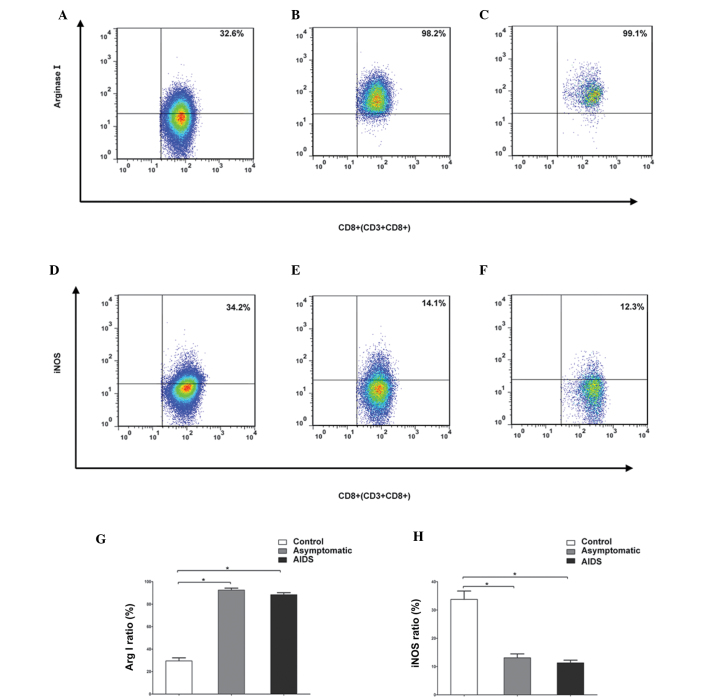
Figure 3.
Flow cytometric analysis of the frequencies of CD8+ T cells positive for Arg I and iNOS in peripheral blood. Compared with the (A) control group, the (B) asymptomatic group and (C) symptomatic AIDS group had a significantly higher frequency of peripheral CD8+ T cells positive for Arg I. Compared with the (D) control, the (E) asymptomatic group and (F) symptomatic AIDS group had a significantly and a markedly lower frequencies of peripheral CD8+ T cells positive for Arg I and iNOS. Numbers represent the percentages of cells in the indicated boxes. (G and H) Frequencies of peripheral CD8+T cells positive for Arg I and iNOS. Values are expressed as the mean standard ± deviation from at least three experiments. *P<0.05. Arg, arginase; iNOS, inducible nitric oxide synthase; LN, lymph node; AIDS, acquired immune deficiency syndrome.

