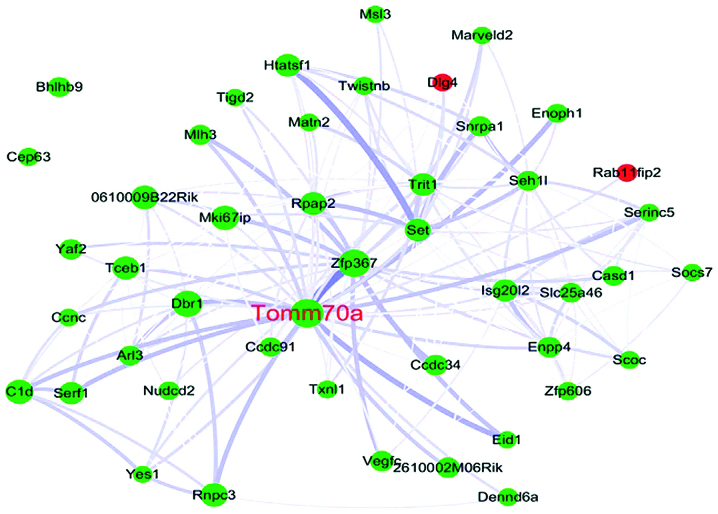
Figure 4.
Interaction of gene co-expression patterns in the blue module. For clarity, only certain nodes are presented. The network was visualized using Cytoscape 3.0 software. The node size is proportional to the connectivity. The edge width is proportional to the connection strength. Downregulated genes and upregulated genes are colored green and red, respectively.

