Figure 2.
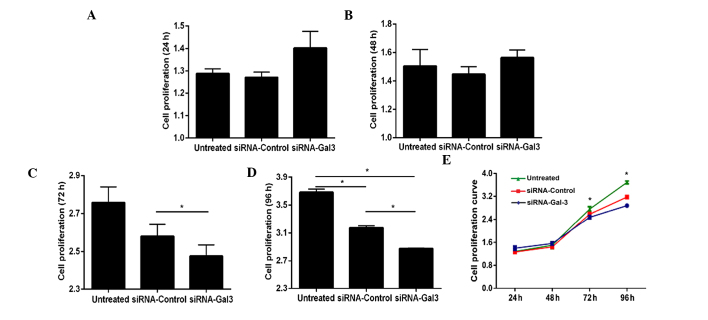
Proliferation capacity of siRNA-Gal-3- and siRNA-control-transfected as well as untreated Eca109 cells. At (A) 24 h and (B) 48 h after transfection with siRNA, no significant differences were observed among three groups (P>0.05). (C) At 72 h after transfection, the proliferation of Eca109 cells in the siRNA-Gal-3 group was lower than that in the siRNA-control group. (D) At 96 h after transfection, the siRNA-Gal-3 treated group showed a significantly decreased proliferation compared with that in the siRNA-control and untreated groups (P=0.004 and P=0.001, respectively). (E) Cell proliferation curve of Eca109 cells in the three groups. Values are expressed as the mean ± standard deviation. *P≤0.05. siRNA, small interfering RNA; Gal, galectin.

