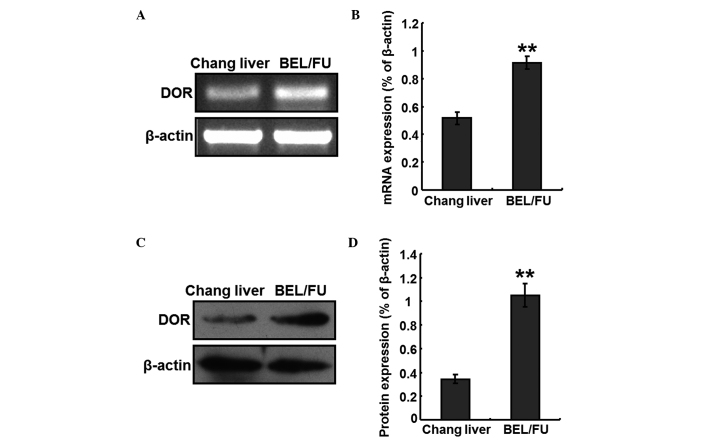
Figure 1.
Expression of DOR in BEL/FU and Chang liver cells. (A) Analysis of the mRNA expression of DOR using reverse transcription-quantitative polymerase chain reaction. (B) Histogram presenting the relative mRNA expression levels of DOR. (C) Western blot analysis of the protein expression of DOR. (D) Histogram presenting the relative protein expression levels of DOR. Data are from three independent experiments and are presented as the mean ± standard deviation. **P<0.05, vs. Chang liver cells. DOR, δ opioid receptor; BEL/FU, BEL-7402/5-fluorouracil.

