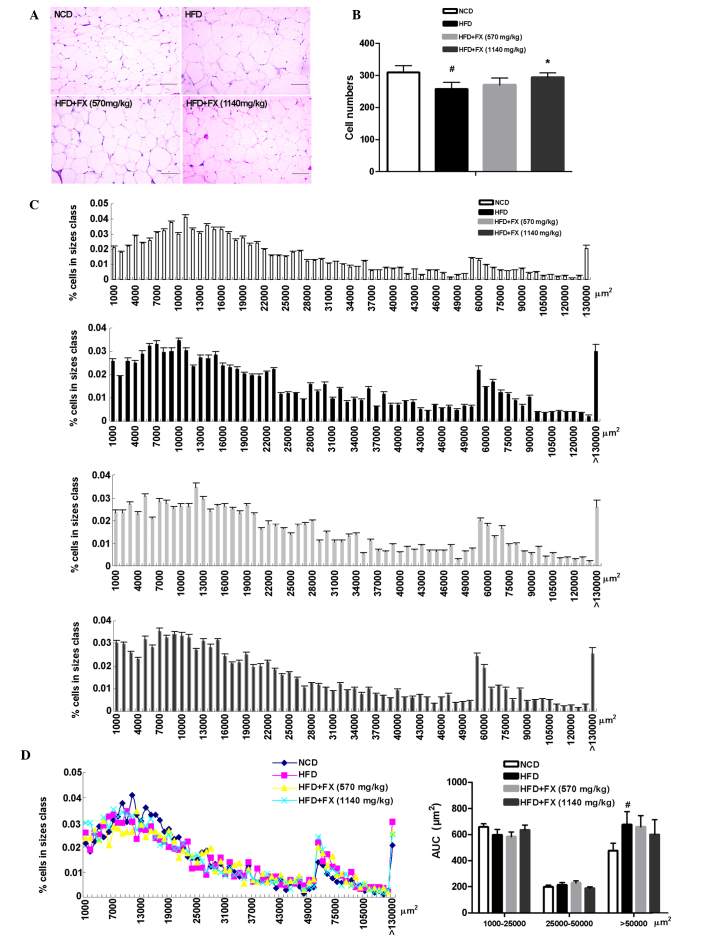
Figure 2.
Effect of FX on epididymal adipose tissue mass. (A) Histological analysis of epididymal adipose tissue. Scale bar, 200 µm (B) Adipocyte numbers. (C) Distribution of adipocyte sizes. (D) Different size and AUC of adipocytes: Small, 1000–25000 µm2; medium, 25,000–50,000 µm2; and large, >50,000 µm2. Data are presented as the mean ± standard error of the mean (n=10). #P<0.05, vs. NCD group; *P<0.05, vs. HFD group. FX, Fructus xanthii; NCD, normal chow diet; HFD, high fat diet. AUC, area under the curve.

