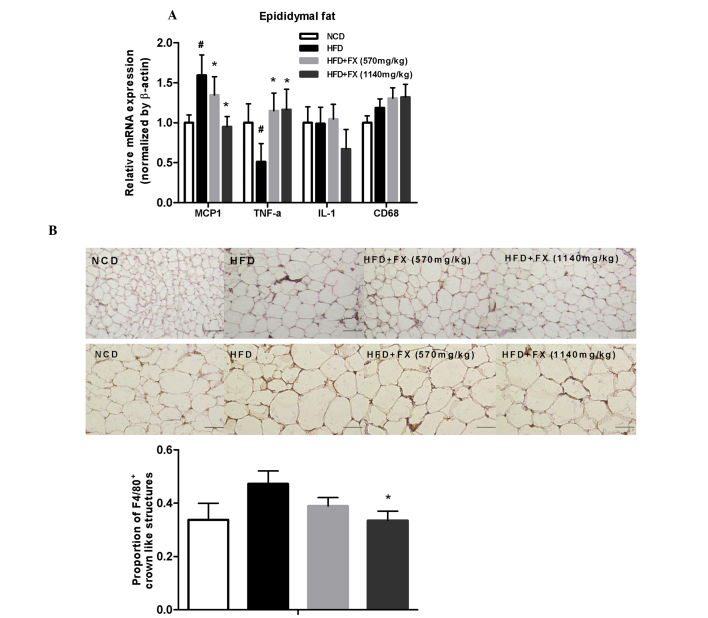
Figure 5.
Effect of FX on inflammation in EF. (A) Expression levels of inflammatory genes. Data are presented as the mean ± standard error of the mean (n=10). #P<0.05, vs. NCD group; *P<0.05, vs. HFD group. (B) Immunohistochemical staining for F4/80. Scale bar=200 µm (top row) and 100 µm (bottom row) Data are presented as the mean ± standard error of the mean (n=5). *P<0.05, vs. HFD group. FX, Fructus xanthii; NCD, normal chow diet; HFD, high fat diet.

