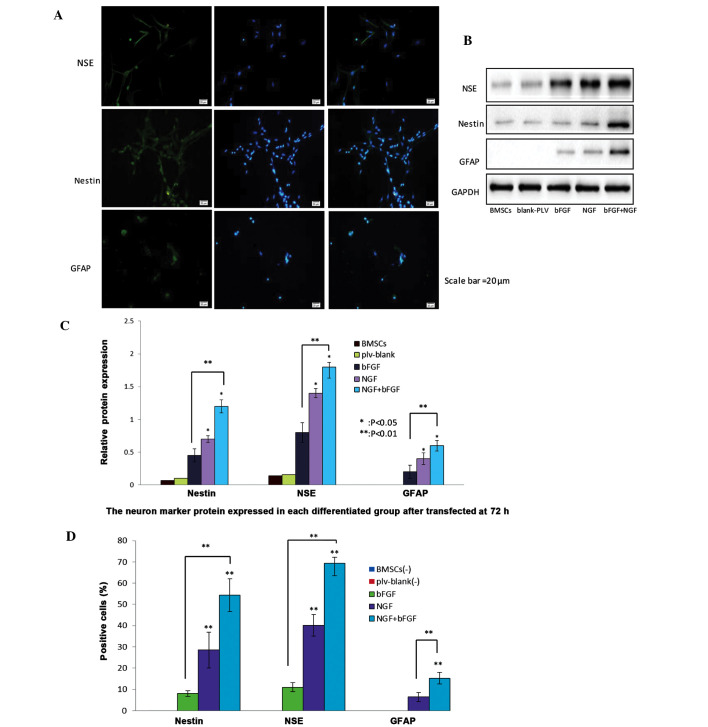
Figure 4.
Protein expression levels of nestin, neuron-specific enolase (NSE) and glial fibrillary acidic protein (GFAP) neuron-markers in nerve growth factor (NGF)- and basic fibroblast factor (bFGF)-transfected bone marrow mesenchymal stem cells (BMSCs) 72 h post-transfection. (A) Differentiated cells were stained with nestin, NSE and GFAP antibodies and counterstained with DAPI (blue). Scale bar=20 µm. The NGF and bFGF co-transfected BMSCs exhibited increased protein expression of nestin, NSE and GFAP, as demonstrated by a marked increase in green fluorescence after 72 h, detected by fluorescence microscopy. (B) Western blotting detected the protein expression levels of neuron markers in the transfected BMSCs after 72 h. The expression levels of the neuron markers were higher in the co-transfected BMSCs group, as compared with the other groups. The untransfected BMSCs and plv-blank-transfected cells exhibited a slight expression of neuron markers. (C) Western blot analysis of the protein expression levels of nestin, NSE and GFAP in the untransfected BMSCs group, plv-blank-transfected BMSCs group, bFGF-transfected BMSCs group, NGF-transfected BMSCs group, and NGF and bFGF co-transfected BMSCs group. Data show the protein levels normalized to GAPDH, and are presented as the mean ± standard deviation (SD) (n=5). *P<0.05, co-transfected group vs. NGF-transfected group, and NGF-transfected group vs. bFGF-transfected group; **P<0.01, co-transfected group vs bFGF-transfected group.(D) Percentage of neural cells positive for nestin, NSE and GFAP in the bFGF-transfected BMSCs group, NGF-transfected BMSCs group, and co-transfected BMSCs group. Data are presented as the mean ± SD (n=5). **P<0.01, each group was significantly different, as compared with the other groups.

