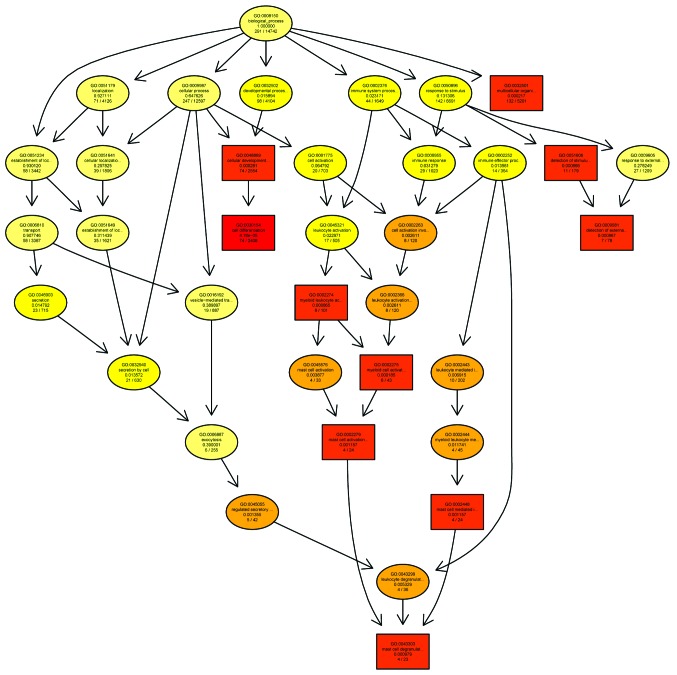
Figure 3.
GO analysis of the downregulated biological process category of the HSCR investigation. The GO Directed Acyclic Graph graphical output shows the enriched GO terms in the downregulated biological process category for the gene network selected in the present HSCR investigation. The boxes represent GO terms and are labeled with the GO ID on the first line, the term definition and information on the second line and the P-value on the third line. The fourth line is labeled with the number of genes associated with the listed GO ID (directly or indirectly) on the selected platform and the total number of genes in the dataset. Annotation moves from more general to more specific with progression from the parent nodes. A gene annotated to a specific node was also considered to be annotated at the parent nodes. The top 10 terms with the lowest P-values and their parents are shown; with the terms with pane marks being significantly enriched. The degree of color saturation for each node is positively correlated with the enrichment significance of the corresponding GO term. The more red-saturated a node is, the greater its significance. in the GO DAG. <1e-20, P-value <1e-20; GO, gene ontology; HSCR, Hirschsprung's disease.

