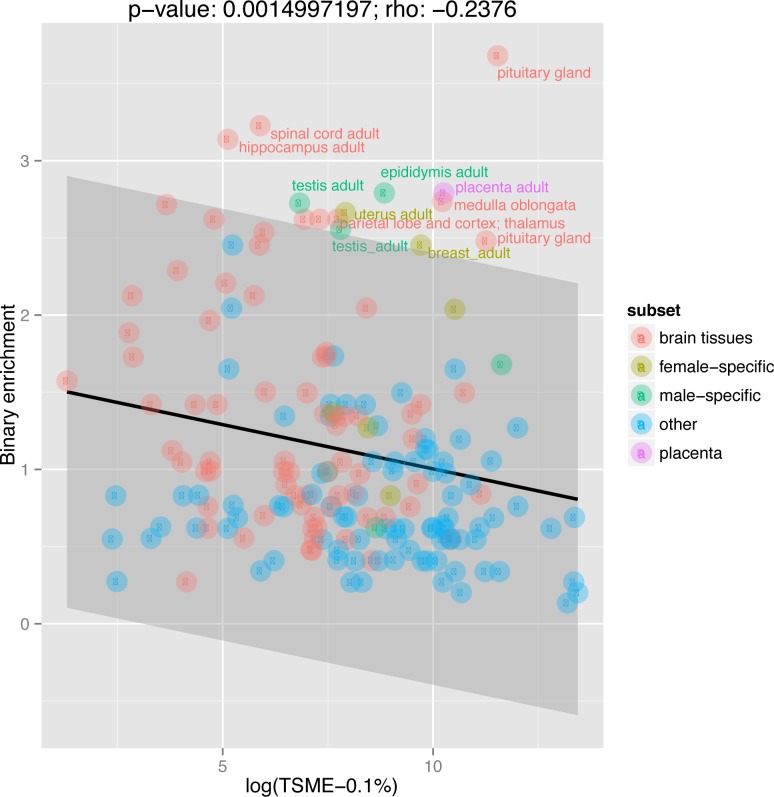
Fig 3. A correlation between tissue-specific maximal expression (TSME) and binary enrichment on the X chromosome.
This figure shows a scatterplot where each data point is a FANTOM5 library (points are colored-coded to highlight brain tissues, sex-specific tissues, and the placenta). X-axis corresponds to the average maximal expression of given tissue’s top 0.1% preferentially expressed genes (i.e., TSME, using a logarithmic scale). Y-axis corresponds to binary enrichment. The strength of the Spearman correlation and p-values are annotated with text above the figure panel. Data points that have standardized residuals more than 1.96 standard deviations (highlighted as grey area) from the linear regression line (which is plotted in black) have their names annotated with text. The underlying data can be found at http://fantom.gsc.riken.jp/5/data/ and in Dryad Digital Repository (doi:10.5061/dryad.p4s57).

