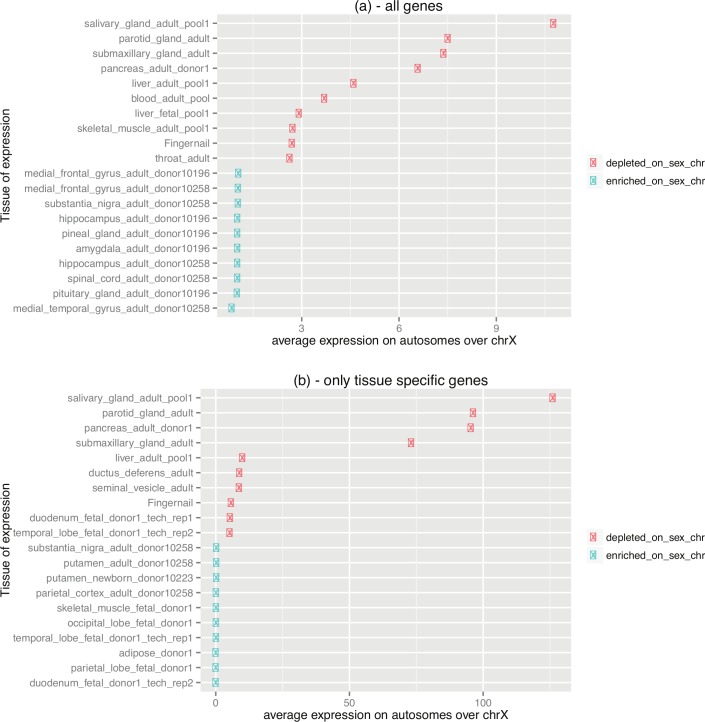
Fig 4. Analog enrichment in expression on the X chromosome.
This figure consists of two panels identifiable as a and b. Each panel shows the ratio of average (per locus) expression on autosomes over that observed on the X chromosome (if the ratio was higher than one given tissue was enriched in expression on autosomes). Panel a shows data for all genes, panel b shows data only for tissue-specific genes (i.e., these with the breadth of expression lower than 0.33). Only the top ten over-represented and the top ten under-represented tissues are shown. Brain subsets are clearly most X-enriched tissues. Exocrine gastrointestinal glands, in contrast, are the most X-depleted tissues. The underlying data can be found at http://fantom.gsc.riken.jp/5/data/ and in Dryad Digital Repository (doi:10.5061/dryad.p4s57).

