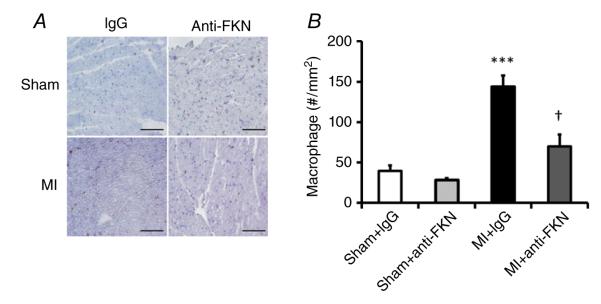
Figure 6. Effect of anti-FKN treatment on macrophage infiltration in WT mice 2 weeks post-MI.
A, representative immunohistochemical staining showing infiltrated macrophages (CD68+ cells, purple colour) in the left ventricle. Scale bar is 100 μm. B, quantitative analysis of macrophage infiltration. n = 4–9 per group. ***P < 0.005 versus IgG-treated sham-operated mice; †P < 0.05 versus MI group treated with IgG.

