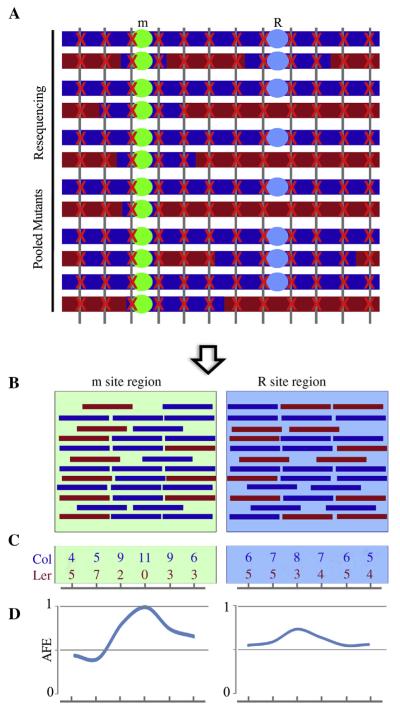
Fig. 5. Analysis strategy and simulative results for mapping-by-sequencing.
A: Schematic of mapping mutants and whole genome sequencing. The m site was selected during the mapping sample pooling process. They are colored after the parental genomes from which they were sampled. The red cross marks reads hit along with the genome. B: Simulative reads aligned to m site region and R site region. Reads in red stand for Ler genome and reads in blue stand for Col genome. C: Examples of reads counts from simulate reads alignment to parental genomes. D: Allele frequency estimations of both m site region and R site region. One Col allele frequency peak should correspond to the causal m site region, while a mild Col allele frequency peak may appear at R site region.

