
Figure 3. Kaplan Meyer curve.
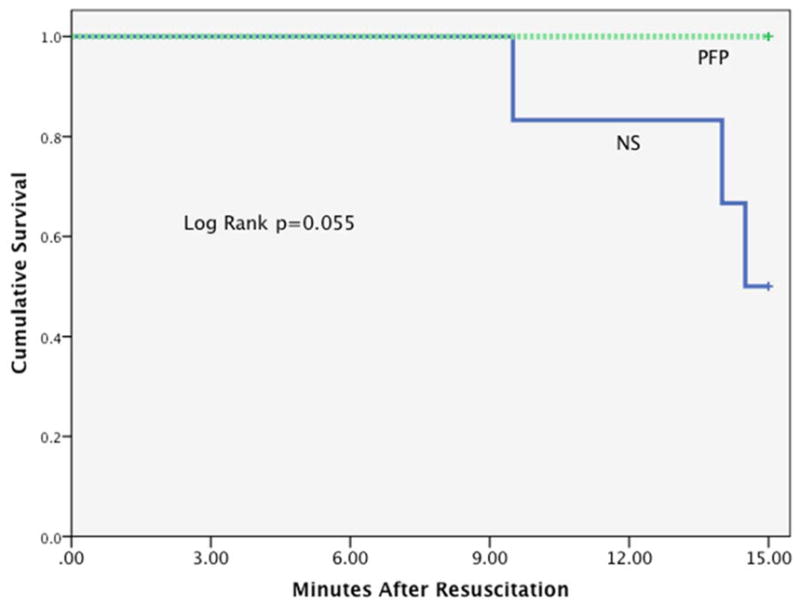
Y axis represents cumulative survival, and X axis represents observation times in minutes.
NS= normal saline; PFP= platelet free plasma; ng= nanogram
Official websites use .gov
A
.gov website belongs to an official
government organization in the United States.
Secure .gov websites use HTTPS
A lock (
) or https:// means you've safely
connected to the .gov website. Share sensitive
information only on official, secure websites.
Y axis represents cumulative survival, and X axis represents observation times in minutes.
NS= normal saline; PFP= platelet free plasma; ng= nanogram