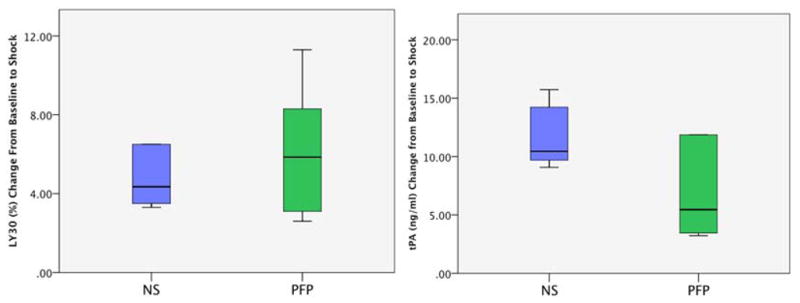
Figure 4.

A, LY30 increased with shock: Y Axis represents the change in LY30 from baseline to shock. Both experimental groups had an increase in LY30 following 30 minutes of hemorrhagic shock.
B, tPA levels increased with shock: Y axis represents the change in tPA from baseline to shock. Both experimental groups had an increase in tPA following shock.
NS= normal saline; PFP = platelet free plasma; MAP = mean arterial pressure; Hem = hemorrhage; Obs = Observation; *= P<0.05
