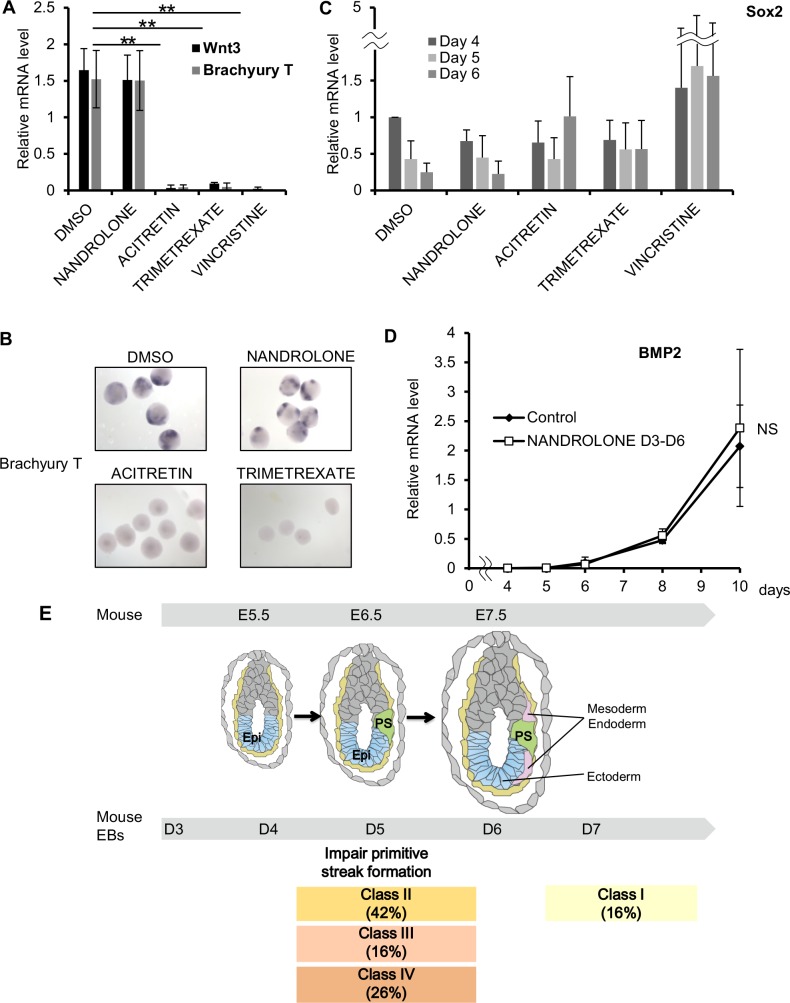
Fig 3. Effects of drug classes on EB gene expression patterns.
(A-C) EBs were treated with the indicated class-representative drugs for days 3–6 of EB culture (>30 EB cultures/group). Samples were collected on days 4–6. DMSO, control; Nandrolone, Class I; acitretin, Class II; trimetrexate, Class III; vincristine, Class IV; SB203580, p38MAPK inhibitor. (A) Quantitative RT-PCR analysis of Wnt3 mRNA on day 6 determined as for Fig 1A. **, P<0.01. (B) In situ hybridization to detect Brachyury T on day 6 in EB cultures treated as indicated for days 3–6. Results are representative of 3 independent experiments (15 EBs/group). (C) Quantitative RT-PCR analysis of the indicated mRNAs on the indicated days determined as for Fig 1B. (D) Quantitative RT-PCR analysis of Bmp2 mRNA in EB cultures that were treated with DMSO (control) or nandrolone on days 3–6. Data were analyzed as for Fig 1A. NS, not significant. (E) Top: Illustration of mouse embryonic and germ layer development at the indicated embryonic days (E). Epi, epiblast; PS, primitive streak. Bottom: Illustration of days (D) of mouse EB culture indicating the percentage of each drug class acting at a particular stage of culture.

