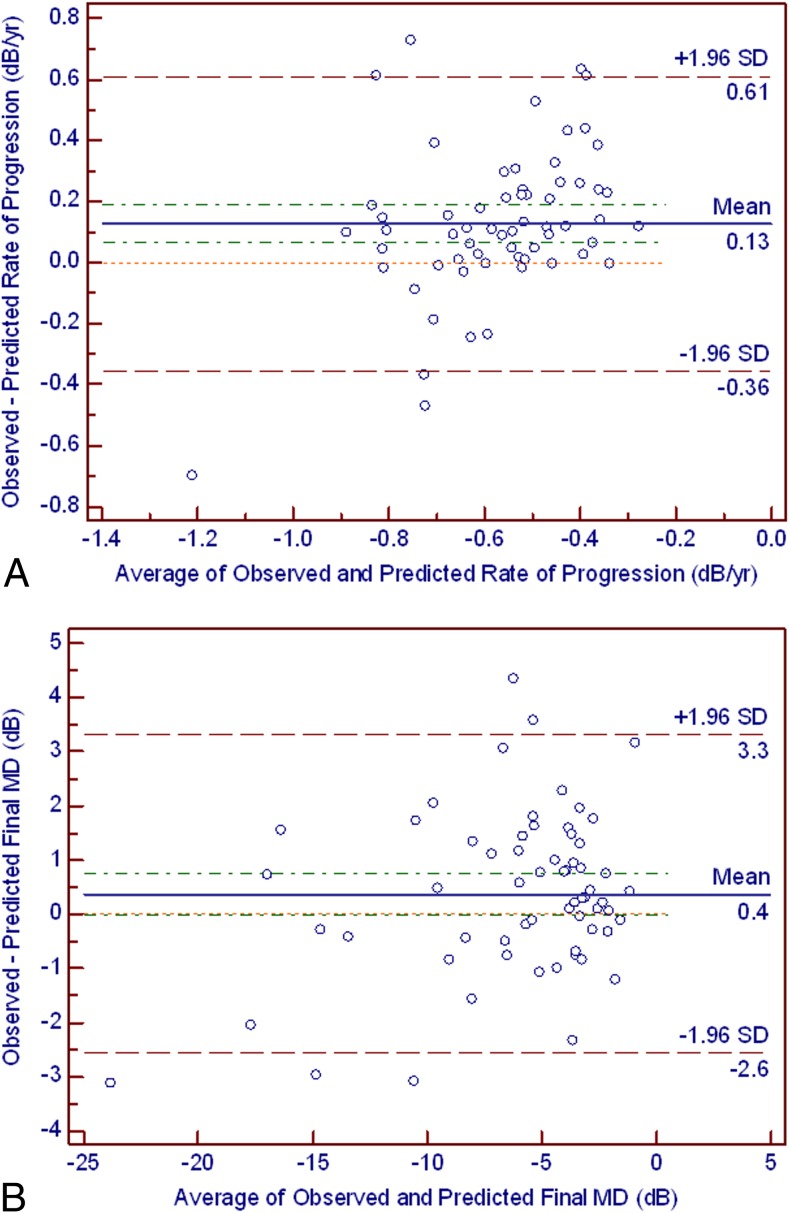
Figure 1.
(A) The Bland-Altman plot illustrates the difference between the observed and predicted rates of visual field progression (y-axis) and their average (x-axis). The green dashed line corresponds to the 95% CI of the mean difference (0.06–0.18 dB). The red dashed line corresponds to the 95% limits of agreement (mean ± 1.96 SD, −0.35–0.61 dB). The orange dotted line in the middle represents the zero difference. (B) The Bland-Altman plot illustrates the difference between the observed and the predicted final MD values (y-axis) and their average (x-axis). The green dashed line corresponds to the 95% CI of the mean difference (0.00–0.75 dB). The red dashed line corresponds to the 95% limits of agreement (mean ± 1.96 SD, −2.56 to 3.31 dB). The orange dotted line in the middle represents the zero difference.

