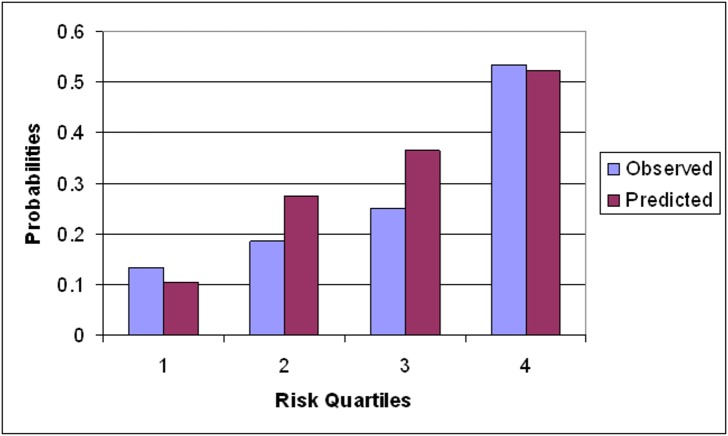
Figure 3.
Calibration plots of prediction of glaucoma progression based on our PLR criteria (two adjacent points in the same hemifield progressing faster than −1.0 dB/year at P < 0.01). The x-axis refers to the quartile of predicted risk based on our risk model. The y-axis refers to the observed frequency of eyes meeting PLR progression criteria within each quartile.

