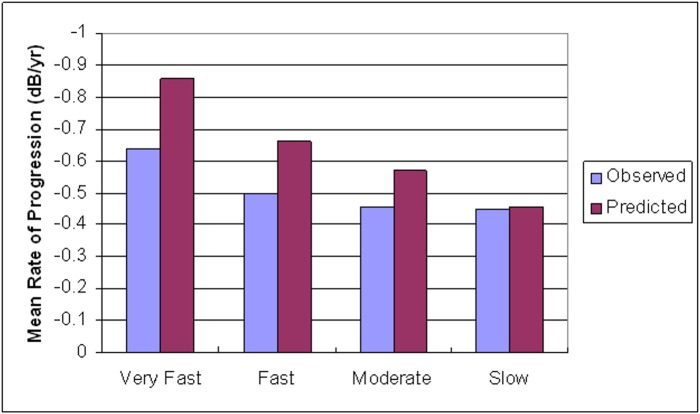
Figure 4.
Comparison of the distribution of global rates of visual field sensitivity change (dB/year) between observed and predicted values in the validation sample. The x-axis corresponds to quartiles based on predicted global rates of progression (dB/year). The y-axis refers to the mean rate of progression within each quartile for observed and predicted values (very fast = −0.71 to −1.13, fast = −0.62 to −0.70, moderate = −0.51 to −0.61, slow = −0.33 to −0.50).

