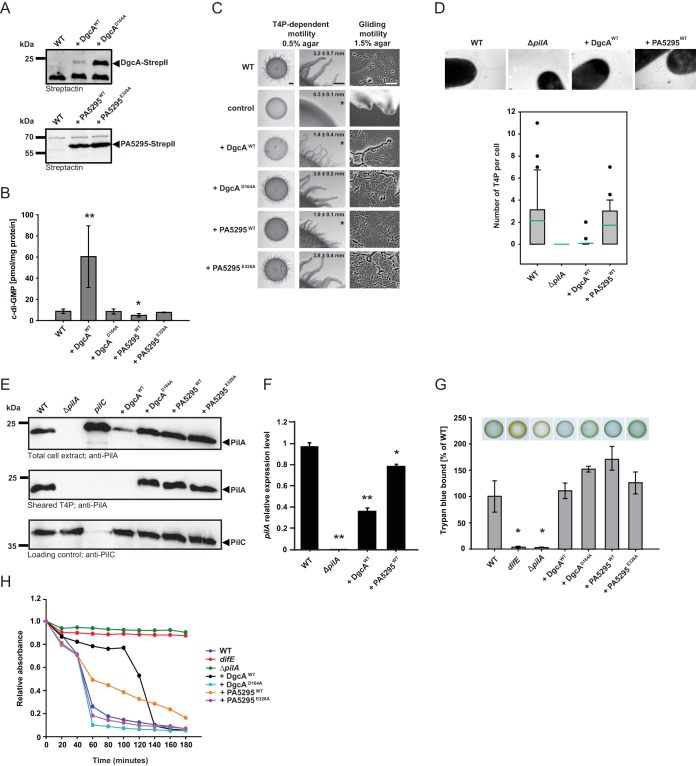
FIG 2.
The c-di-GMP level is important for T4P-dependent motility. (A) Immunoblot detection of Strep II-tagged DgcA and PA5295 and their active-site variants. Total protein was isolated from exponentially growing cells expressing the indicated proteins. Total protein from the same number of cells (7 × 10⁷) was loaded per lane, and blots were probed with streptactin. DgcAWT and PA5295WT have calculated molecular masses of 26.8 kDa and 63.6 kDa, respectively. (B) c-di-GMP level in exponentially growing cells expressing the indicated proteins. The levels of c-di-GMP are shown as the mean ± SD from six (WT as well as DgcAWT- and PA5295WT-expressing cells) or three (DgcAD164A- and PA5295E328A-expressing cells) biological replicates. *, P < 0.05 in a Student's t test; **, P < 0.001 in a Student's t test. (C) Motility assays. T4P-dependent motility and gliding motility were analyzed on 0.5% and 1.5% agar, respectively. DK1217 is deficient in gliding motility and DK1300 is deficient in T4P-dependent motility, and these strains were used as negative controls. T4P-dependent motility was quantified by the increase in colony diameter; numbers indicate the mean increase in colony diameter (in millimeters) ± SD from three biological replicates after 24 h. *, P < 0.05 in a Student's t test. Bars, 1 mm (T4P-dependent motility, left column), 500 μm (T4P-dependent motility, right column), and 50 μm (gliding motility). (D) (Top) Images obtained by transmission electron microscopy of exponentially growing cells expressing the indicated proteins. Cells were transferred to a grid, stained with 2% (wt/vol) uranyl acetate, and visualized by transmission electron microscopy. Bars, 100 nm. (Bottom) The box plots show the number of T4P per cell for at least 20 cells. Boxes indicate the 25th and 75th percentiles, the green line indicates the mean, whiskers indicate the 10th and 90th percentiles, and dots indicate outliers. (E) Immunoblot detection of PilA in total cell extract and in sheared T4P. (Top and bottom) Total protein was isolated from the indicated strains grown on 1% CTT agar plates; (middle) T4P were sheared off from the same number of cells used for the top and bottom panels and concentrated by MgCl2 precipitation. In all three blots, protein from the same number of cells was loaded per lane. The top and middle blots were probed with anti-PilA antibodies. The bottom blot was probed against PilC, which is important for T4P assembly and served as a loading control. PilA and PilC have calculated molecular masses of 23.4 kDa and 45.2 kDa, respectively. (F) qRT-PCR analysis of pilA expression. RNA was isolated from the indicated strains grown on 1% CTT–1.5% agar plates. The pilA transcript level relative to that of the WT is shown as the mean ± SD from two biological replicates, each with three technical replicates. *, P < 0.05 in a Student's t test; **, P < 0.001 in a Student's t test. (G) Quantification of EPS accumulation. Exponentially growing cells expressing the indicated proteins were assayed for EPS accumulation using a colorimetric assay. The percentage of trypan blue bound by a strain relative to the amount bound by the WT (100%) is indicated. The levels of trypan blue binding are shown as the mean ± SD from three biological replicates. *, P < 0.05 in a Student's t test. For the plate-based assay, 20-μl aliquots of cell suspensions at 7 × 10⁹ cells/ml were spotted on 0.5% agar supplemented with 0.5% CTT and 20 μg/ml trypan blue and incubated at 32°C for 24 h. (H) Cell agglutination assay. Agglutination was monitored by measuring the decrease in absorbance at 550 nm for a suspension of cells in agglutination buffer. The relative absorbance was calculated by dividing the absorbance measured at each time point by the initial absorbance for each strain. The graph shows data from one representative experiment.

