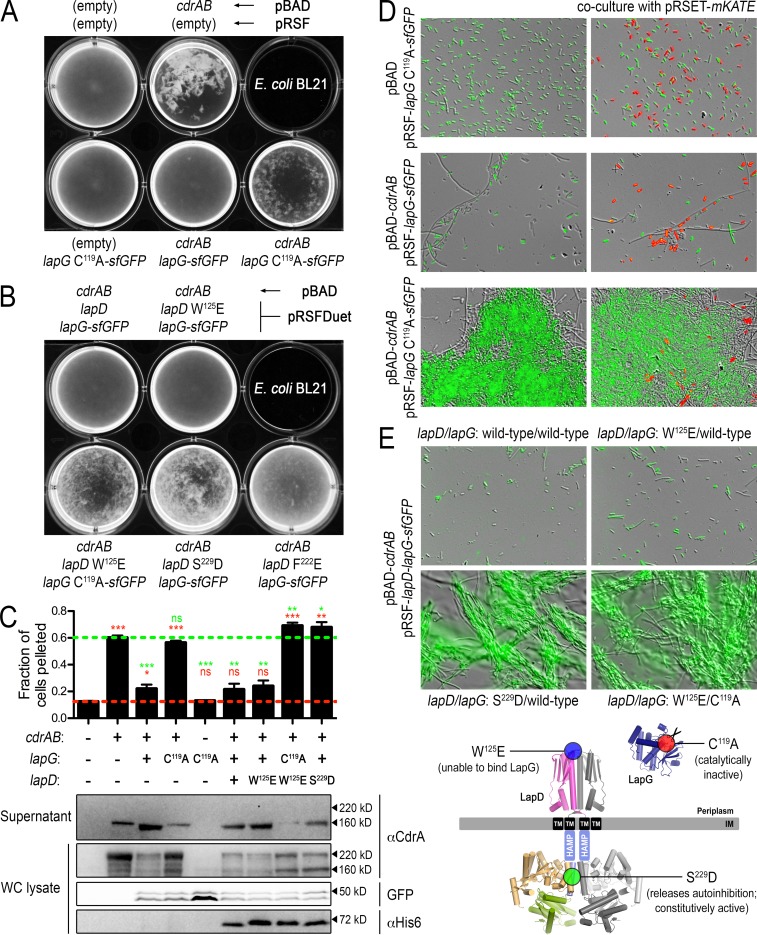
FIG 5.
Regulation of CdrA-dependent cell autoaggregation by the LapDG receptor system in a heterologous host. (A) Direct visualization of E. coli BL21 cultures expressing CdrAB and periplasmic P. aeruginosa LapG-sfGFP. The pBAD and pRSF expression constructs for each culture are as indicated (written above for the top row and below for the bottom row). (B) Similar visualizations of E. coli cell autoaggregation as in panel A but with full-length LapD coexpression alongside CdrAB and LapG-sfGFP. (C) Top, propensity for the cultures shown in panels A and B with robust phenotypes to sediment (as described in Materials and Methods). Higher values indicate greater autoaggregation. Red and green dashed lines indicate values obtained for native, dispersed E. coli cells and those aggregating due to expression of only CdrAB. Red and green asterisks above each sample indicate statistical comparisons to the cells grown with empty plasmids and cells expressing only CdrAB, respectively. The numbers of asterisks indicate P values as described in the legend for Fig. 4. Those that are not statistically different are indicated with “ns.” Bottom, for each of the cultures in the top panel, protein levels of CdrA in supernatant and whole-cell lysates were analyzed by Western blotting. Also analyzed in the whole-cell lysates were LapG-sfGFP (by in-gel fluorescence) and LapD (by Western blotting with an anti-His5 antibody). Approximate molecular masses are shown to the right of each gel. (D) Cultures shown in the bottom row of panel A were imaged by differential interference contrast and GFP fluorescence at a magnification of ×40 to reveal microscopic features of the autoaggregated cells (left column). Cells expressing only the red fluorescent protein mKate did not aggregate with the CdrAB-expressing cells (right column). A small fraction of cells expressing CdrAB appear as long filaments, independent of the expression of active or inactive LapG. However, this appearance has no obvious impact on the overall autoaggregation phenotypes. Also, cells that appear unlabeled show a lower level of fluorescence that is detectable upon longer exposure times. (E) Similar overlays of differential interference contrast and GFP fluorescence images of cell aggregates from LapD-coexpressing strains displaying robust phenotypes shown in panel B. Bottom, mutations used to alter the functionality of LapD and LapG mapped onto their respective structural models.

