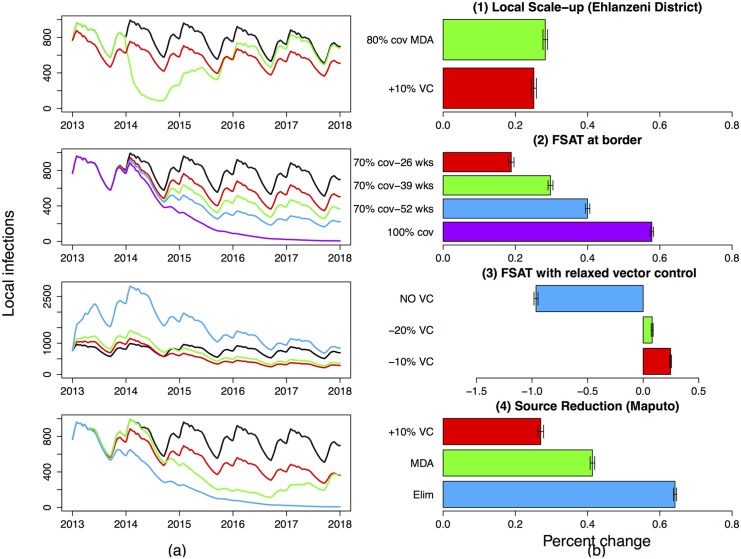
Fig 4. Predicted impact of interventions on the number of local infections in the Ehlanzeni district (summation of the five local patches).
(a) shows the impact of the interventions on local infections in Ehlanzeni district through time compared to the base case of no interventions (black) and (b) shows the percentage change (increase or decrease) in point estimates of local infections due to the interventions between 2013 and 2018. (1) Local Scale-up: Increase in local vector control so as to reduce the mosquito-human contact rate by a further 10% (red), three consecutive two-monthly rounds of MDA in Mbombela, Nkomazi and Bushbuckridge Municipalities (green). (2) FSAT at the border: at 70% coverage for 26 weeks (red), 39 weeks (green), 52 weeks (blue) and 52 weeks at 100% coverage (purple). (3) Reducing Vector Control: FSAT at the border at 70% coverage administered all year round while simultaneously reducing vector control by 10% (red), 20% (green) and stopping vector control altogether (blue). (4) Source Reduction: 10% scale up of vector control in Maputo (red), three consecutive two-monthly rounds of MDA in Maputo (green) and eliminating malaria in Maputo (blue). The base case of no intervention is shown in black.

