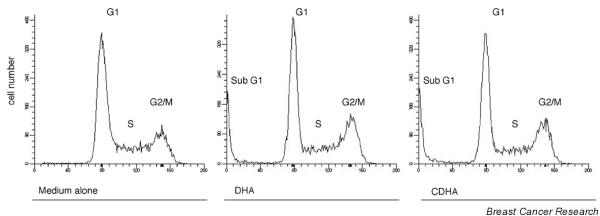
Figure 2.

Cell cycle analysis of KPL-1 cells grown in medium alone or treated with 270 μmol/l docosahexaenoic acid (DHA) or 97 μmol/l conjugated DHA (CDHA) 50% inhibitory concentration [IC50] for 72 hours, respectively) for 72 hours. Appearance of sub-G1 fraction is seen after DHA and CDHA treatment.
