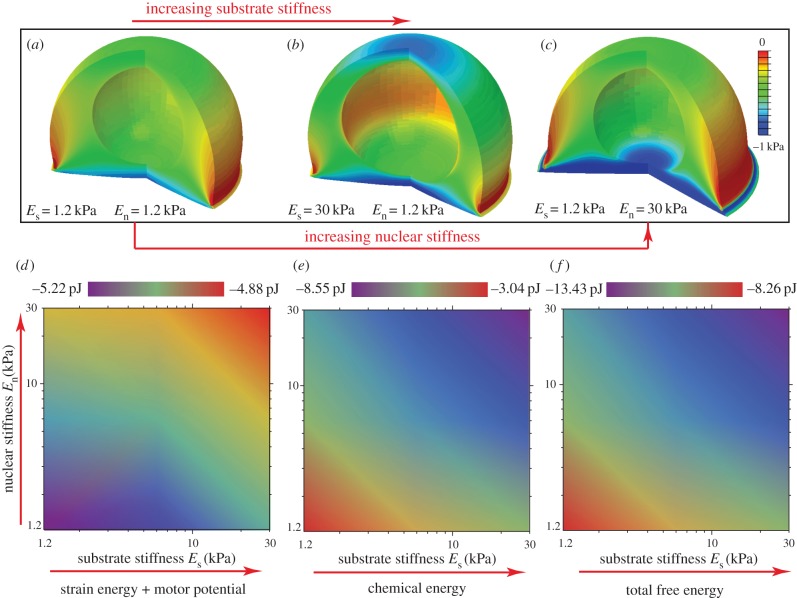
Figure 8.
(a–c) The steady-state distributions of the free energy of the cytoskeleton for varying substrate and nuclear stiffnesses: Es = 1.2 kPa, En = 1.2 kPa (a), Es = 30 kPa, En = 1.2 kPa (b), Es = 1.2 kPa, En = 30 kPa (c). (d–f) Contour plots of Ustrain+motor (d), Uchem (e) and Utotal (f) of the cell-substrate system as functions of substrate stiffness Es and nuclear stiffness En. (Online version in colour.)

