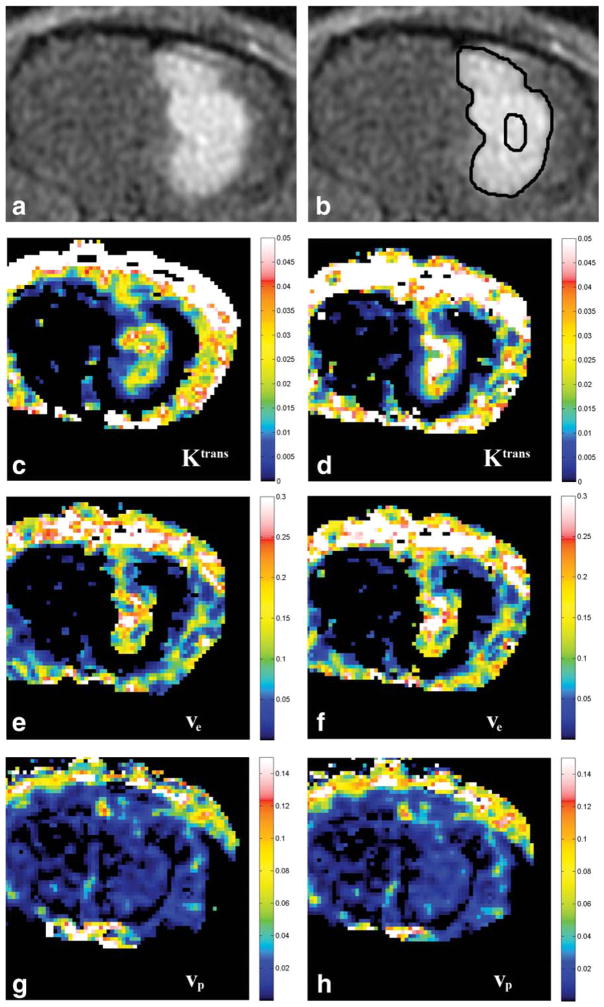
Figure 1.
A: Representative post-contrast T1 image of an animal brain tumor. B: Example of ROIs drawn for the whole lesion and the central core. C–H: Representative parametric maps for each of the vascular parameters using gadofosveset and gadopentetate. C: Ktrans map using gadofosveset. D: Ktrans map using gadopentetate. E: ve map using gadofosveset. F: ve map using gadopentetate. G: vp map using gadofosveset. H: vp map using gadopentetate.

