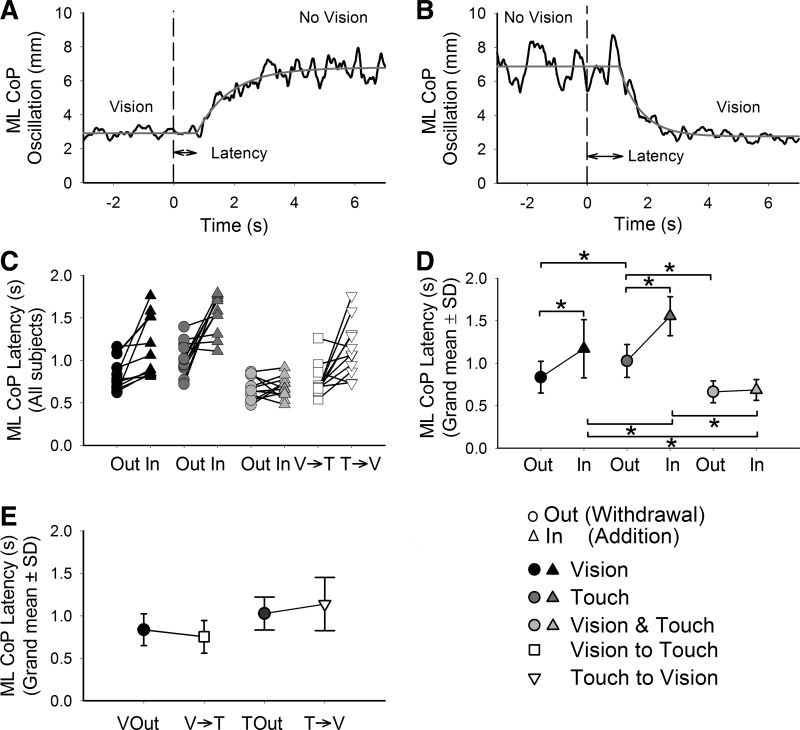
Fig. 4.
Latencies of CoP oscillation following the change in sensory state. The upper panels show the mean curves of CoP oscillation of a representative subject during withdrawal (A) and addition (B) of V (black; at t = 0) and the fitted-exponential function (gray). The segments between the arrowheads under the curves indicate the latencies. In C, the latencies calculated for the CoP oscillation of each subject in all 4 conditions are presented. The grand mean and SD of the latencies in sway for the V, T, and V&T conditions are provided in D. In the labels of the abscissae of C and D, “Out” is used to indicate withdrawal and “In” addition (the symbol key is at the bottom right). The latencies were shorter on withdrawal than addition. They were longest following addition of T and shortest following addition of V&T. In E, the grand mean and SD of the latencies following withdrawal of V, withdrawal of T, and the replacement of V with T and vice versa are provided. The asterisks indicate significant differences.

