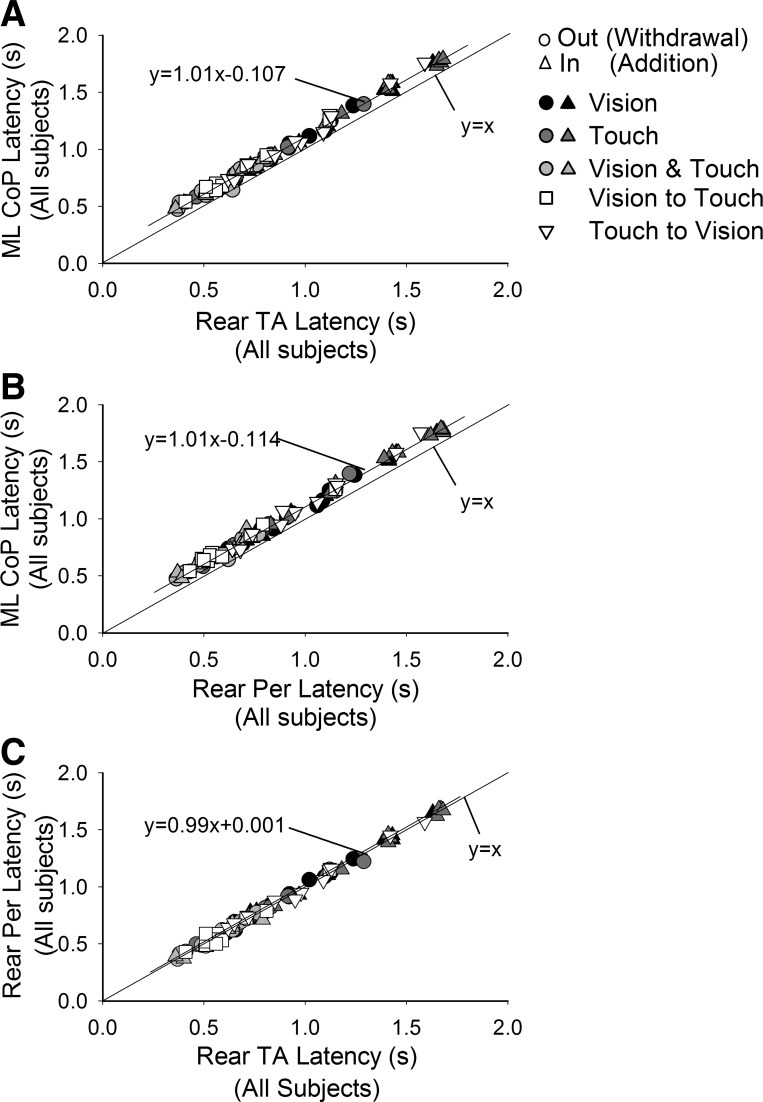
Fig. 5.
Latencies of change in muscle activity following change in sensory state. Latencies of CoP oscillation levels are plotted against the latencies of rear TA (A) and rear Per (B) EMG for the different conditions (symbols as in Fig. 4), and the best-fit line is drawn. The identity line (y = x) is also indicated. Changes in muscle activity always preceded those of sway by ∼110 ms. In C, latencies of rear Per are plotted against those of rear TA. The data points sit on the identity line indicating equal mean latency between muscles for each condition.

