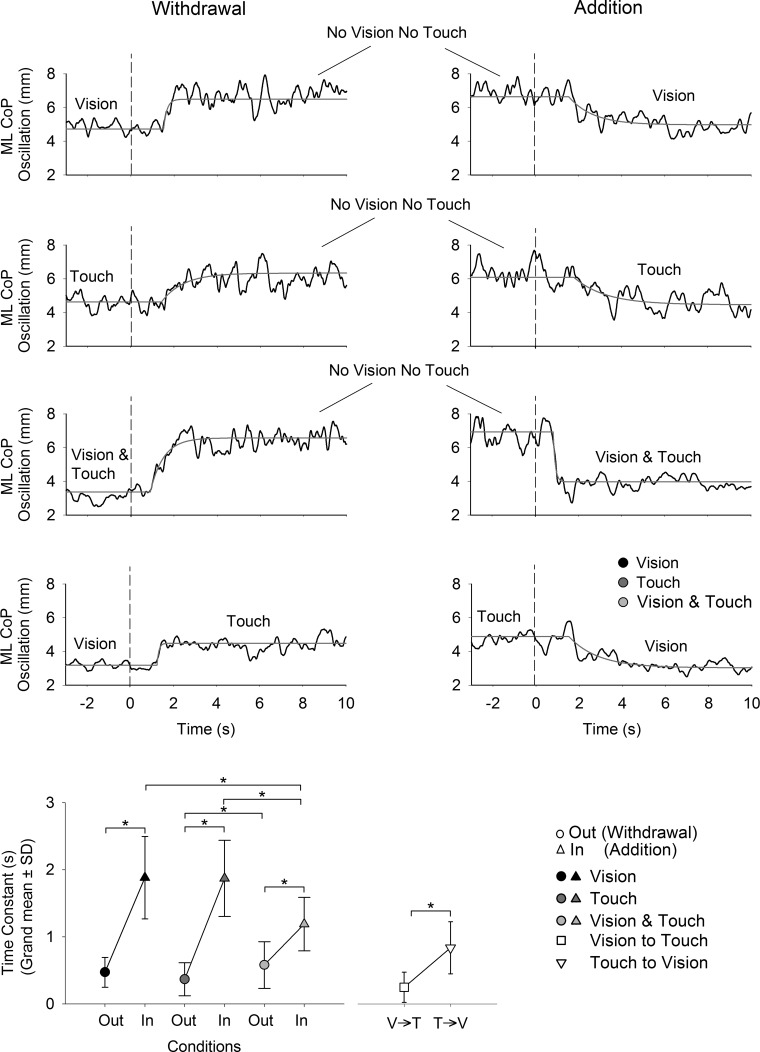
Fig. 7.
Time constant of the recovery to steady-state following the sensory shift. Upper panels show the mean curves of the CoP oscillation (black) and the fitted exponential function (gray) in all conditions. The grand mean and SD for the time constant calculated for all subjects in each condition are provided in the bottom graph. The times constants were generally shorter on withdrawal than addition of V and/or T. The time constants were also shorter following addition of V and T simultaneously with respect to the addition of V alone and T alone. The asterisks indicate significant differences.

