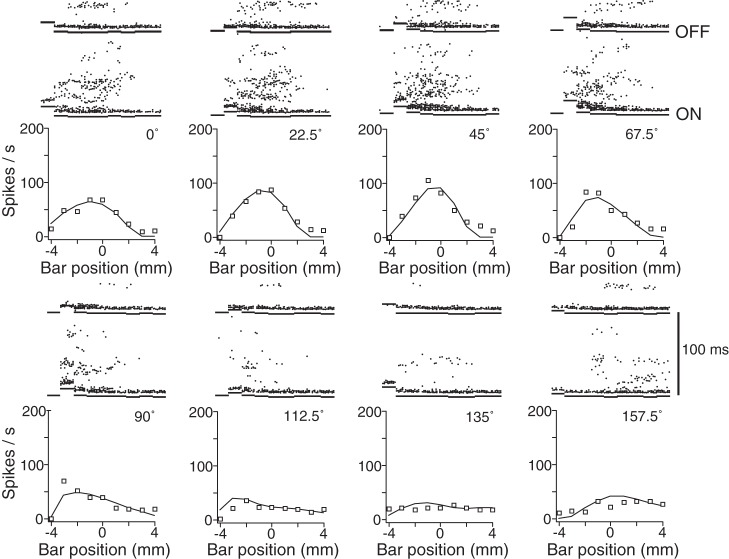
Fig. 2.
Responses to the 72 stimulus configurations for area 3b neuron N17. For each of 8 bar orientations (22.5° increments), Bensmaia et al. (2008a) applied the bar at 9 positions, ranging ±4 mm from the nominal RF center (here defined as position 0) in a direction orthogonal to the bar's long axis. Graphs show the neuron's responses (squares) and RF model fit (curves). Above each x-axis position are the raster plots for 10 stimulus repetitions at that position and orientation (note: time runs vertically in these raster plots, and repeated trials are separated horizontally). ON and OFF line segments demarcate times estimated to just precede response onset and (100 ms later) response offset, between which the spike count was summed. Note that N17 preferred stimuli oriented at ∼45°.

