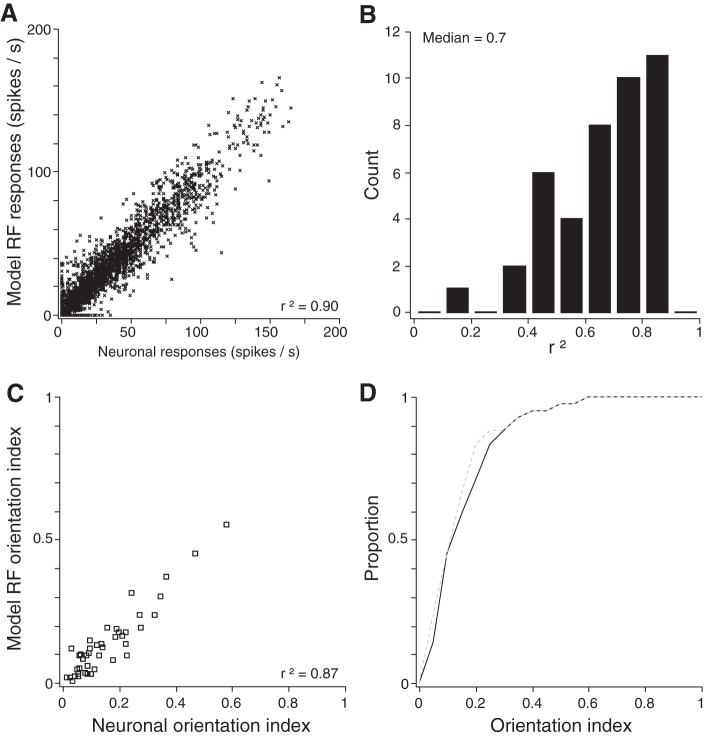
Fig. 7.
Goodness of fit between the model RF assigned each neuron by the Bayesian classifier and the neuron's physiologically observed responses. A: scatter plot showing the best-fit model RFs' firing rates and the observed neuronal firing rates across the entire data set (72 responses × 42 neurons = 3,024 data points). B: histogram of r2 values obtained individually for each neuron, relating the neuron's best-fitting model RF to the observed responses from the neuron (across all 72 stimulus conditions). C: scatter plot showing the orientation index (OI) of each best-fit model RF and that of the corresponding area 3b neuron. D: cumulative distribution of orientation indices for the area 3b neurons (solid black curve) and their best-fitting model RFs (gray dashed curve).

