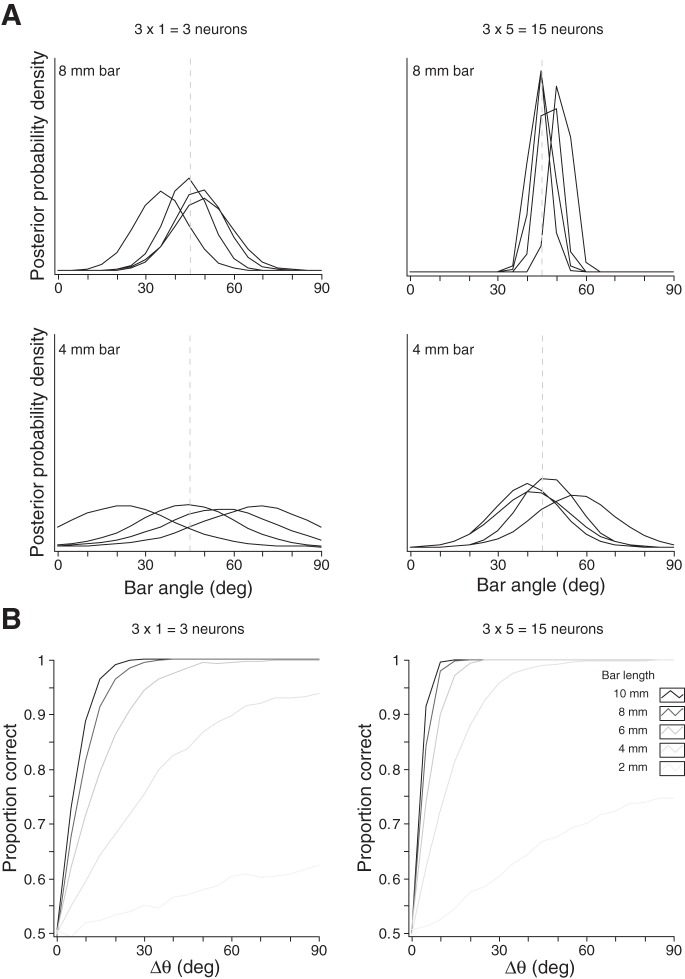
Fig. 8.
Performance of an ideal observer. Simulations were performed using the best-fitting model RF for area 3b neuron N17 (Symmetric Gabor RF). Left: 3 RF orientations × 1 neuron per orientation; right: 3 RF orientations × 5 neurons per orientation. A: each panel shows the ideal observer's posterior distributions over bar orientation in response to 4 repeated trials with a bar oriented at 45° (vertical dashed lines). Top: 8 mm bar length; bottom: 4 mm bar length. The ideal observer's posterior distributions over bar orientation vary stochastically from trial to trial. However, the observer's confidence increases, and its responses become less variable, when bar length increases (compare bottom and top) or when the observer is endowed with a greater number of cortical RFs (compare left and right). B: psychometric functions show the ideal observer's proportion correct discrimination when tested with 2 sequentially presented bars of equal lengths but differing in angle by Δθ. Bar length is represented by line intensity. Proportion correct increased with Δθ, bar length, and the number of cortical neurons in the ideal observer's pool.

