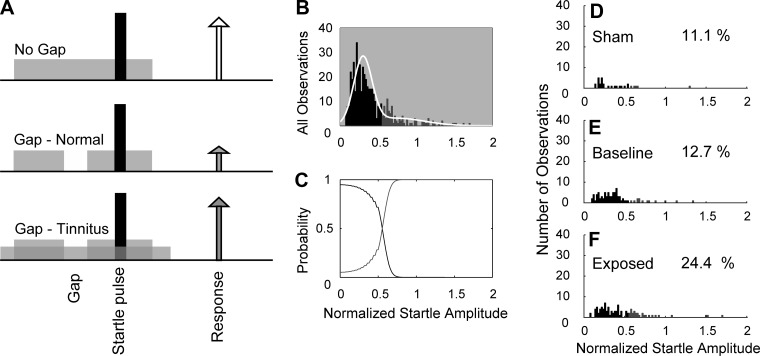
Fig. 2.
Gap-prepulse inhibition of acoustic startle (GPIAS). A: schematic outlining the startle-based gap-detection assay for tinnitus [Reproduced from Koehler and Shore 2013b. Copyright 2013 with permission from the Society for Neuroscience]. Top row reveals no gap with the bottom two rows showing gap trials (50-ms gap, 50 ms before the startle stimulus). Each trial consisted of continuous 60-dB background noise (gray bar) with a 10-ms, 115-dB startle pulse embedded (black bar). The animal responds to the startle stimulus, with the amplitude of the response shown by the height of each arrow. In noise-exposed animals without tinnitus (ENT), the gap leads to suppression of the startle response (middle row). In animals with noise-induced tinnitus, the gap is filled by tinnitus (gray arrows), and no gap induced reduction in startle response (white arrow). B–F: Gaussian mixture model analysis separating startle distribution into normal and tinnitus. B: histogram of the normalized startle responses (white line) separated into two distributions: no evidence for tinnitus (black bars) and evidence for tinnitus (gray bars). C: probabilities that normalized startle values belong to tinnitus or no tinnitus distributions. D: histogram of the distribution of postexposure normalized startle observations for sham-controls. E: histogram of the distribution of normalized startle observations for baseline (preexposure) observations from sham and noise-exposed animals. F: histogram of the distribution of postexposure startle observations from noise-exposed animals. D–F: percentage of observations placed into the tinnitus group is shown on each panel.

