Fig. 4.
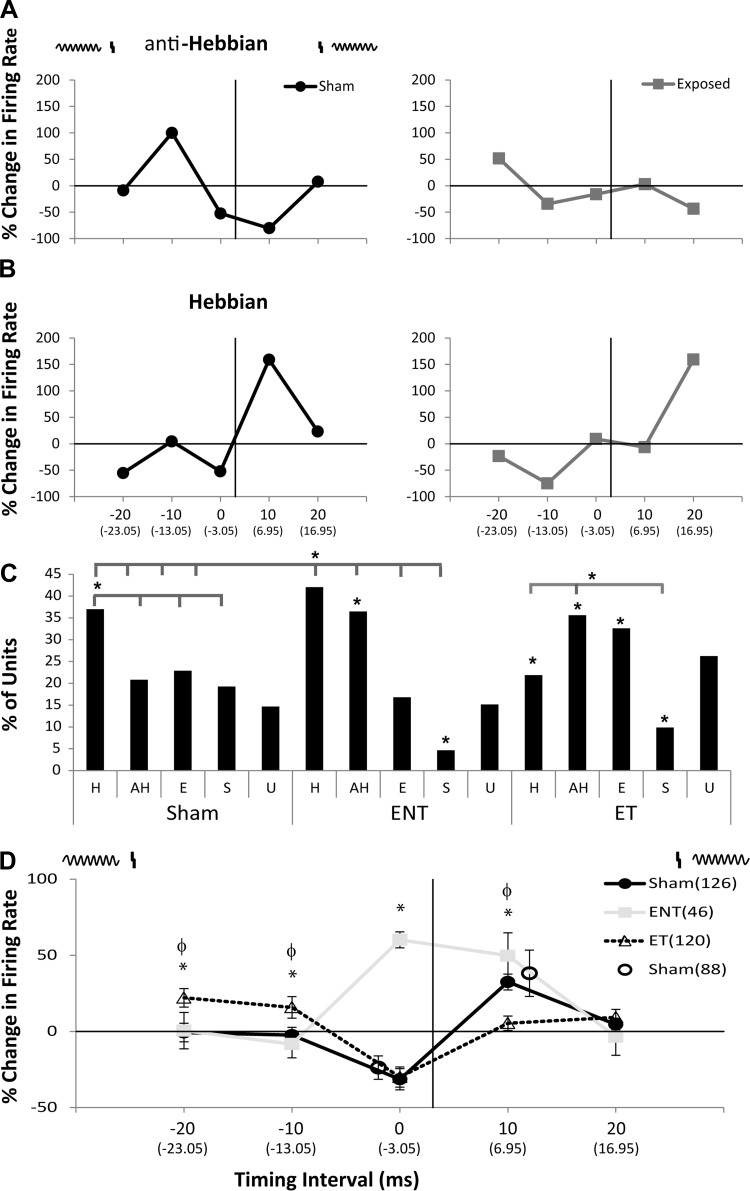
Bimodal plasticity shifts from Hebbian to anti-Hebbian-like and enhancing timing rules with less discrete temporal windows in animals with tinnitus and to mostly anti-Hebbian timing rules in guinea pigs without tinnitus. A: two examples of single-unit anti-Hebbian-like timing rules from a sham-control (left) and noise-exposed (right) guinea pig. A schematic at the top of the panel demonstrates the relationship of the Sp5 stimulus (vertical line) and the tone stimulus (sinusoid). At each BI a correction factor was calculated where the timing of the unimodal stimulus onset was subtracted from the bimodal stimulus onset (correction factor listed in parentheses below the respective BI). B: two examples of single-unit Hebbian-like timing rules from a sham-control (left) and noise-exposed (right) animals. C: bar graph showing the percentage of single units that showed Hebbian (H), anti-Hebbian (aH), enhancing (E), and suppressing (S) and undefined (U) timing rules from sham-controls (left), ENT (middle), and ET (right) animals. Within the ET group a larger percentage of anti-Hebbian and enhancing rules were seen compared with shams that predominantly showed Hebbian timing rules. Animals in the ENT group also showed a greater number of anti-Hebbian timing rules compared with sham controls. Significant differences were found between sham, ENT, and ET groups [overlying bar denotes individual comparison (tabs) that is statistically significant compared with the reference (*P < 0.05; Tukey-Kramer's post hoc test); asterisk under bar denotes comparison to sham-controls for that respective timing rule]. D: mean timing rules showing bimodal plasticity of tone-evoked firing rates for units from sham-control (dark line), ENT (gray line), and ET (dashed line) animals. Schematic above represents the order of Sp5 and tone stimuli. The vertical line indicates Sp5 stimulation with the sinusoid representing tone stimulus onset. Mean timing rules were calculated for BIs and stimulus order from across all layers of A1 with error bars that indicate SE. At each BI a correction factor was calculated where the timing of the unimodal stimulus onset was subtracted from the bimodal stimulus onset (correction factor listed in parentheses below the respective BI). To demonstrate the effects of bimodal trials separate from the randomized protocol on sham-control responses using the maximal suppressive (0 ms) and enhancing (10 ms) pairings, the mean change in firing rates (open circles; n = 88 single units) and SE are plotted in relationship to sham-controls at the same BI and order from responses obtained during the randomized set. Note similar responses to each maximal pairing when stimulated alone without a randomized protocol. Significant differences were found between sham-controls, ENT, and ET groups: *P < 0.05; Tukey-Kramer's post hoc test compared with sham controls with ET being significantly different at −20 and −10 ms and ENT at 0 ms; and ϕP < 0.05 compared with the ET group with sham and ENT both significantly different from ET at −20, −10, and +20 ms and the ENT group being different from ET at 0 ms.

