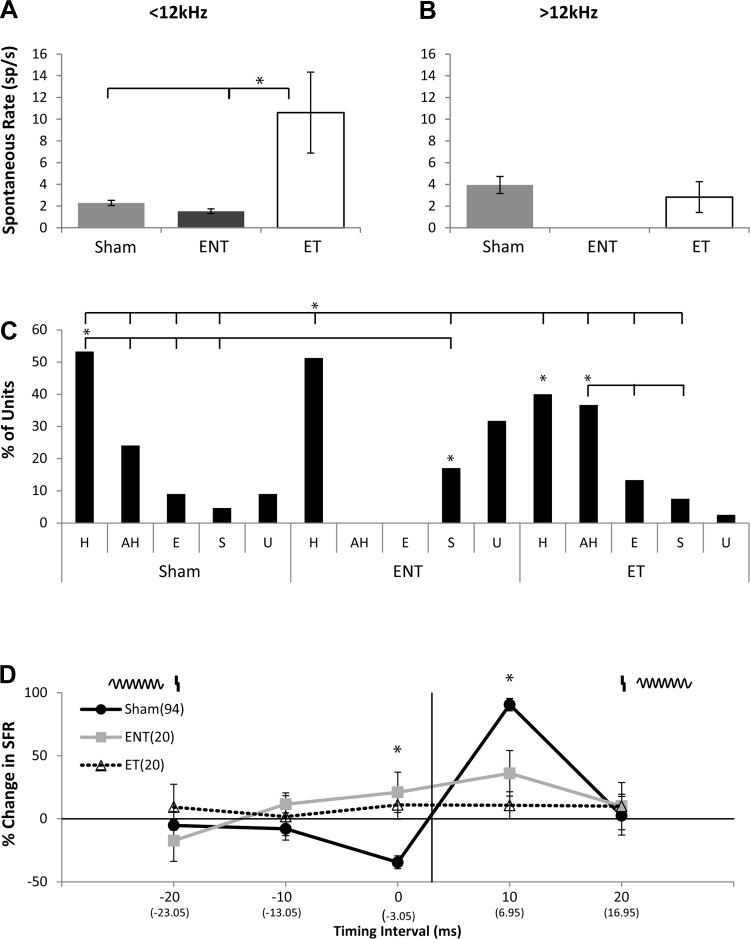
Fig. 5.
Spontaneous firing rates (SFRs) are significantly increased in the ET group but not in ENT animals. A: mean SFRs for units with best frequencies < 12 kHz. Note the significant increase in the ET group compared with sham (*P < 0.003). B: mean SFRs for units with best frequencies > 12 kHz. C: bar graph showing the percentage and distribution of timing rules for SFRs from sham-controls (left), ENT (center), and ET (right) following bimodal stimulation. Overlying bar denotes individual comparison (tabs) that is statistically significant compared with the reference (*P < 0.05; Tukey-Kramer's post hoc test; asterisk under the bar denotes comparison to sham-controls for the respective timing rule). D: mean percent change in SFRs and timing rules revealing bimodal plasticity for single units from sham-controls (black line; 94 units), ENT (gray line; 20 units), and ET (dashed line; 20 units) animals. Mean timing rules were calculated for all measurements across all layers of A1. Error bars indicate SE. Significant differences were found between sham-controls, ENT, and ET groups (*P < 0.05; Tukey-Kramer's post hoc test compared with sham-controls).

