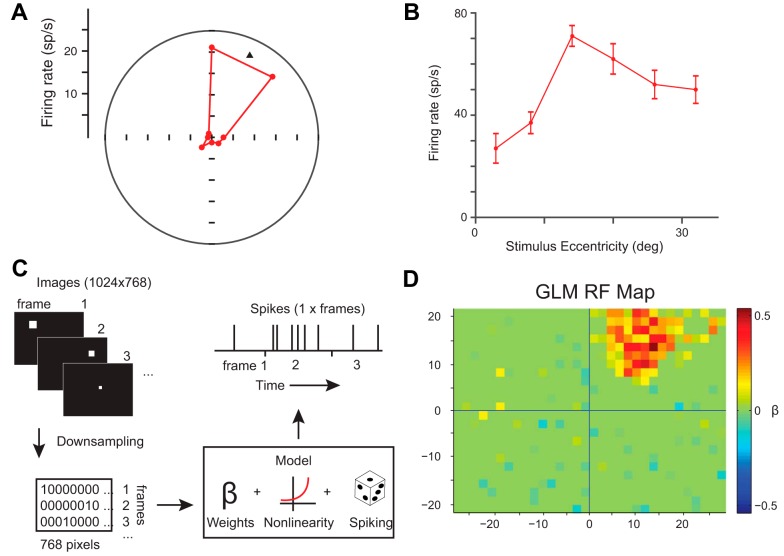
Fig. 1.
Conventional and probabilistic (glmRF) receptive field (RF) mapping for an example neuron. A: polar plot illustrating direction tuning of the visual response (50–150 ms after target onset) during the memory-guided saccade task. The black triangle indicates the vector fit of the preferred direction. sp/s, Spikes per second. B: tuning of the visual response at 6 eccentricities along the preferred direction. deg, Degrees. C: schematic illustrating the generalized linear model (GLM); see materials and methods for details. D: resulting glmRF for this neuron.

