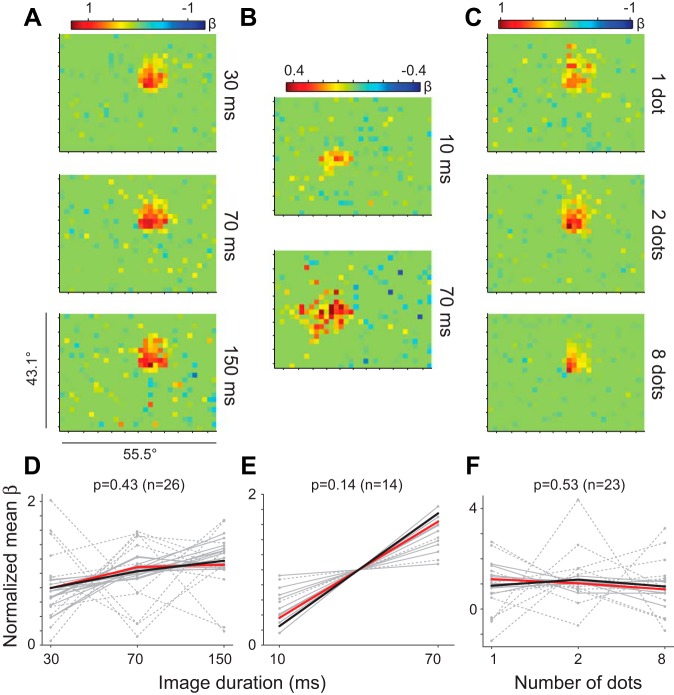
Fig. 5.
Spatiotemporal tuning by task. A–C: example glmRFs for 3 neurons (1 for each task). D: image duration task where a dot was held on the screen for 30, 70, or 150 ms before a new dot location was chosen. E: image duration task with each dot held on the screen for 10 or 70 ms. Note that 1 outlying neuron was removed for display purposes (although it followed the same trend). F: dot density task with image duration held at 70 ms while the number of dots per image was 1, 2, or 8. Dashed lines represent cells that failed the cross-validation test. Each panel (D–F) shows the normalized mean β for each of the recorded neurons (gray lines) in all conditions, with the mean across neurons shown by a thick black line. Red lines represent example neurons.

