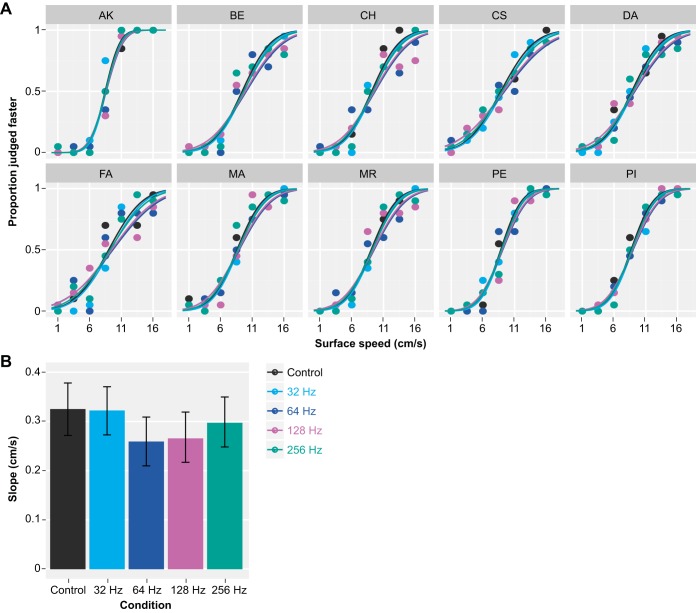
Fig. 5.
Results of the speed discrimination task on the ridged surface (experiment 2). A: individual responses with GLMM fits. In contrast to the fine-textured surface, vibratory noise reduced the precision (slope) of the response only moderately on the ridged surface. B: albeit much weaker, vibratory noise of 64 Hz (dark blue) and 128 Hz (magenta) again had the strongest effect on the precision, followed by vibratory noise of 256 Hz (green) and 32 Hz (light blue). Vertical error bars show 95% confidence intervals.

