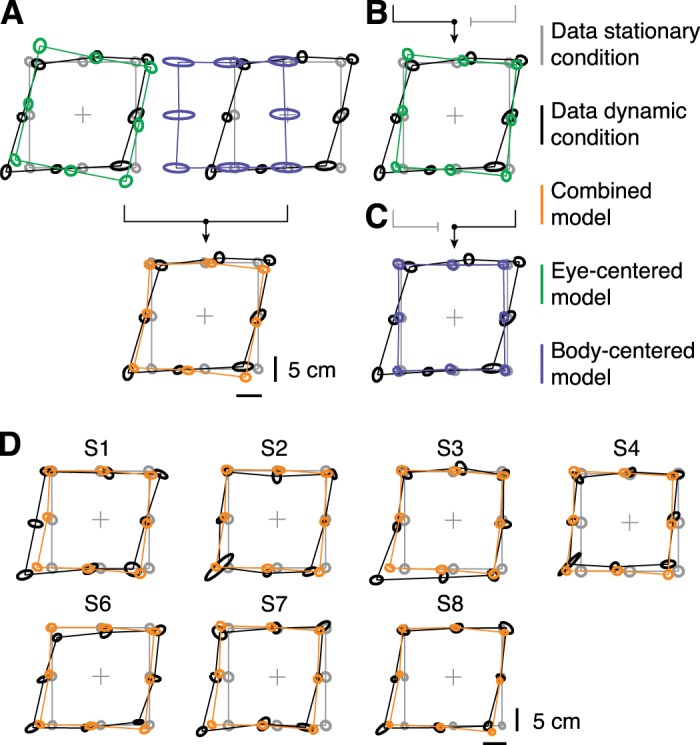
Fig. 6.

Top view of measured and predicted memorized target locations. Ellipses represent target location estimates from the stationary condition (gray), dynamic condition (black), and model fit (orange). Center and outline of the ellipses represent mean and covariance across 16 data points, respectively. A: an eye-centered (green) and body-centered representation (blue) are optimally combined (orange) and fitted to the responses of S5 (black). B and C: the fits when the model only uses the eye-centered (green) or body-centered (blue) representation, respectively, for S5. D: data (black) and fits of the combined model (orange) for the remaining participants.
