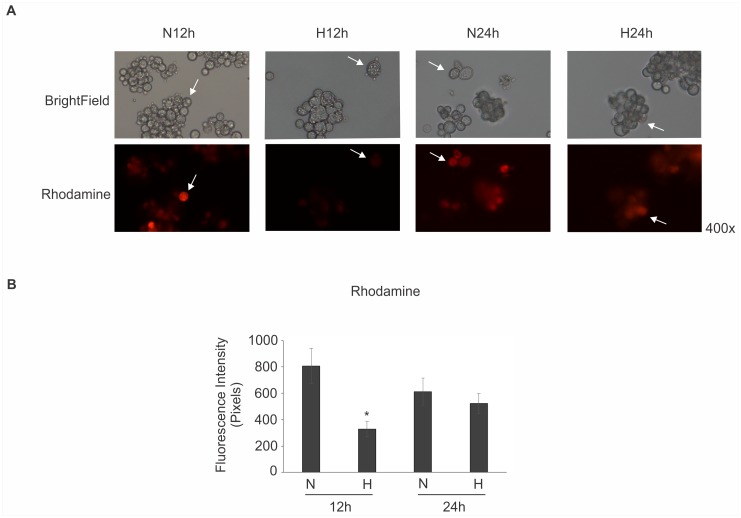
Fig 2. Mitochondrial activity of Paracoccidioides submitted to normoxic and hypoxic stress.
(A) Pb01 yeast cells were grown in BHI medium in normoxia (N), 21% pO2, and hypoxia (H), 1% pO2, for 12 and 24 h. The mitochondrial activity was evaluated by using rhodamine as a dye for mitochondrial membrane potential. The lower intensity of mitochondria activity was detected in 12 h of hypoxia. The white arrows indicates representative cells from population. (B) The rhodamine fluorescence intensity of cells grown in normoxia (N) and hypoxia (H) for 12 and 24 h was measured using the AxioVision Software (Carl Zeiss). The values of fluorescence intensity (in pixels) and the standard deviation of each analysis were used to plot the graph. Data are expressed as mean ± standard deviation (represented using error bars) of the minimum of 100 cells for each microscope slide, in triplicates, for each condition. *, significantly different comparison with normoxia condition, at a P value of ≤ 0.05.

