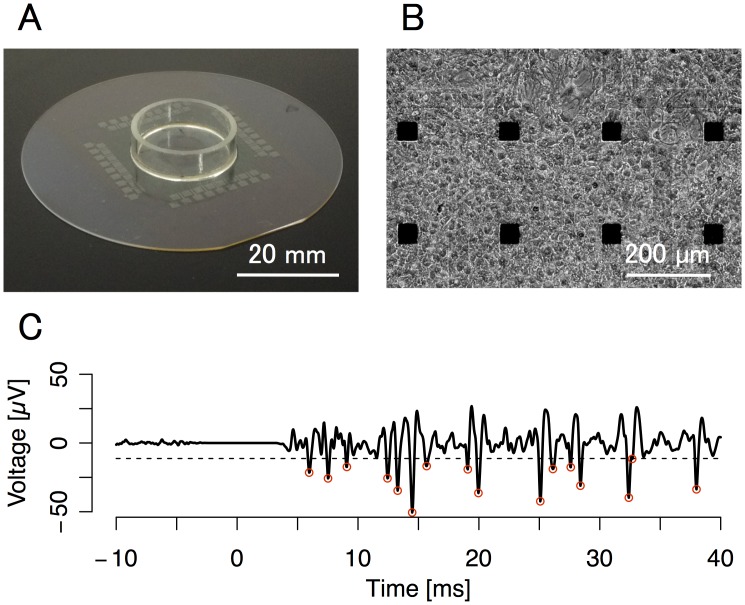
Fig 1. Description of the cultured neuron network paradigm.
Panels show culture dish (top left), microscopic view of rat cortical cells (top right), and evoked voltage trace from one electrode (bottom). (A) Image of a microelectrode array (MEA) dish. Cells were seeded in the center of the MEA dishes. The microelectrode sampling frequency was 25 kHz and a 500–2000 Hz band-pass filter was applied to the recordings. (B) Phase-contrast microscopic images of cultured rat cortical cells on MEA dishes after 52 days in culture. Note the high concentration of cells near the electrode terminals. Black squares are electrodes. (C) A typical waveform of the extracellular potential. After a biphasic-pulse electrical stimulation (τ = 0), several stimulation-evoked spikes were observed at the stimulated electrode. The dashed line indicates the detection threshold. Red circles indicate detected spikes.

