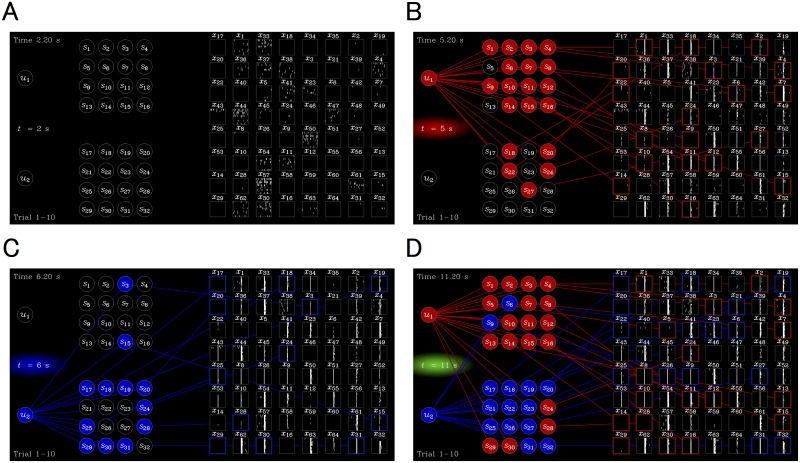
Fig 3. Overview of the experiment.
Snapshots of S1 Movie at the u = (0,0), (1,0), (0,1), and (1,1) state, respectively, are shown. Setup is with the same as that described in Fig 2A: hidden sources u 1 and u 2 (left), merged inputs s 1, …, s 16 (middle top), s 17, …, s 32 (middle bottom), and unit activities of cultured neurons x 1, …, x 64 (right). Each of the 64 panels on the right shows a raster plot of neural activity (unit activity) recorded at the electrode, where horizontal and vertical axes are 400 ms time window and trials 1–10, respectively. (A) When u = (0,0), evoked responses were not observed since there was no input, although spontaneous activities were recorded. (B) When u = (1,0), a group of s 1, …, s 16, became 1 (red circles in the middle) with a high probability (namely, a = 3/4 probability), while a group of s 17, …, s 32 became 1 with a low probability (1–a = 1/4). If s i (i = 1, …, 32) was 1, an electrical pulse stimulation was induced into a fixed corresponding electrode. Consequently, evoked responses were observed immediately after each stimulation. (C) When u = (0,1), a situation exactly opposite to that described in (B) occurs. (D) When u = (1,1), all stimulated electrodes (s 1, …, s 32) were stimulated, providing the largest evoked response.

