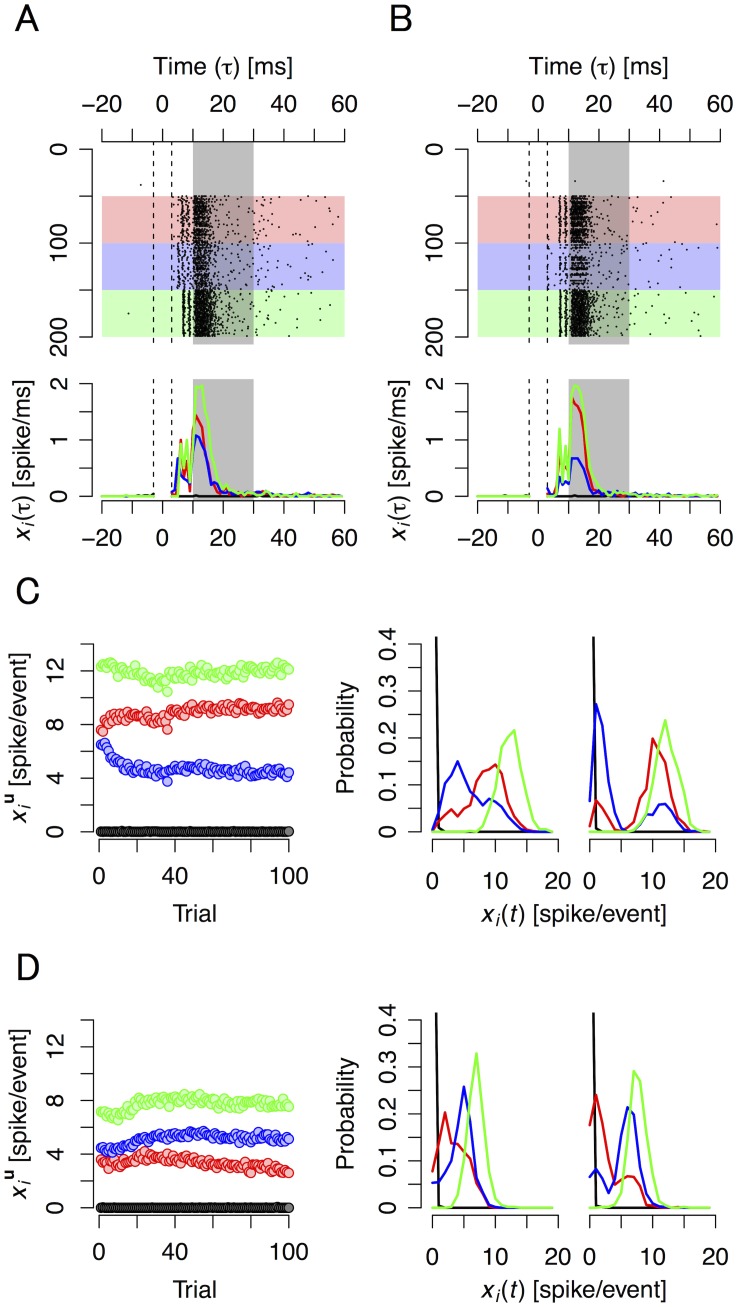
Fig 4. Examples of neural responses to different stimulus inputs.
Raster plots of successive evoked responses before and after learning (A and B) for four source states; spikes-per-event transition over learning, average and histogram, for four source states and two different electrodes (C and D). (A) Top panel: A raster plot showing a typical pattern of stimulation-evoked spikes in cultured neurons recorded with an electrode at trial 1 (before training). Red circles indicate the timing of spikes. The horizontal axis corresponds to time (ms), and the vertical axis is the stimulation number sorted by source state. White, red, blue, and green areas indicate responses when the state of the source was u = (0,0), (1,0), (0,1), and (1,1), respectively. Between τ = –3 and 3 ms (area surrounded by dashed lines), reliable data were not obtained because of switching noise (artifact). Bottom panel: Post stimulus time histogram (PSTH) at trial 1. Black, red, blue, and green curves are PSTH when the state of the source was u = (0,0), (1,0), (0,1), and (1,1), respectively. (B) Same as (A), but at trial 100 (after training). (C) Left panel: example of a typical transition over trials of the conditional expectation of an evoked response recorded with the same electrode as in (A) and (B). Black, red, blue, and green circles give the conditional expectation of evoked responses when the state of the source was u = (0,0), (1,0), (0,1), and (1,1), respectively. Center and right panels: The conditional probability distributions of evoked responses recorded with the same electrode during trials 1 to 10 (center panel) and trials 91 to 100 (right panel). The four curves correspond to the four states of u. (D) Same as (C), but recorded with a different electrode.

