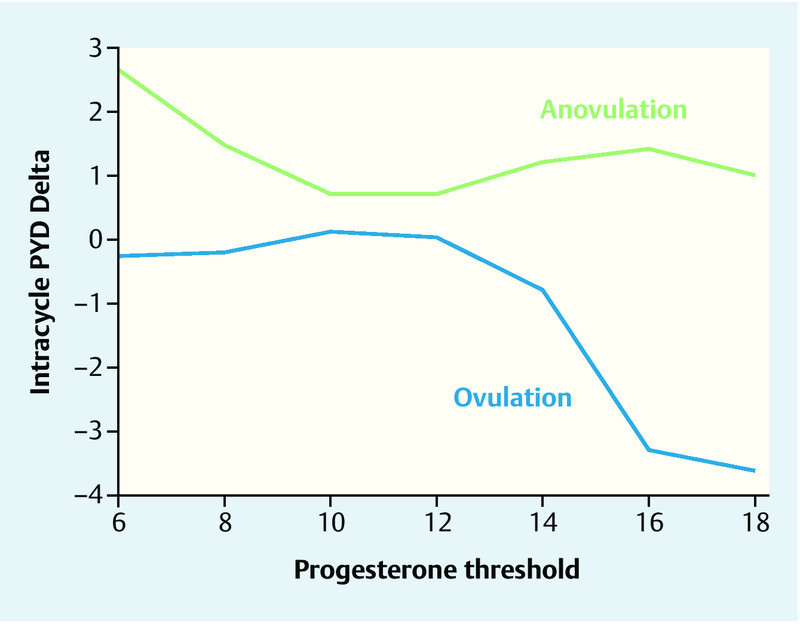
Fig. 2.

Intra-cycle changes of bone resorption marker pyridinoline (PYD) with rising progesterone threshold. The x-axis displays the rising progesterone threshold, the y-axis shows the difference in PYD between luteal and follicular phase (Δ [delta] = [LP] – [FP]). Positive values indicate that luteal phase values are higher than follicular phase values. Negative values indicate that luteal phase values are lower than follicular phase values. The blue line shows the respective delta values for ovulatory cycles, the green line for anovulatory cycles. In the individual participants, bone resorption declined in the luteal phase of ovulatory cycles, while remaining higher in anovulatory cycles. The difference seems to grow with higher progesterone thresholds applied for the discrimination between ovulatory and anovulatory cycles.
