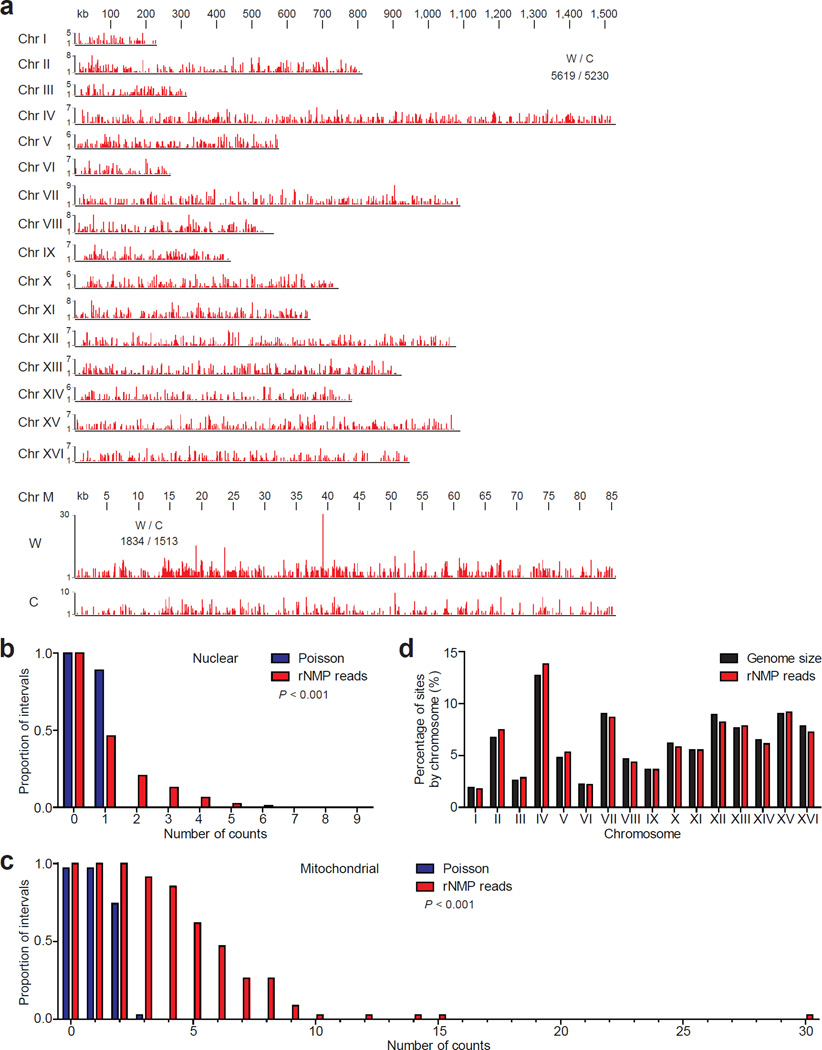
Figure 2. Distribution of rNMP incorporation in the S. cerevisiae genome.
(a) Ribose-seq map of rNMPs in genomic DNA from rnh201Δ (KK-100) cells. The data, as peaks of rNMP reads in red, are shown for the individual nuclear chromosomes (Chr I–XVI) and the two strands of mitochondrial DNA (Chr M). The height of each peak corresponds to the number of reads. A comparison of nuclear and mitochondrial rNMP reads for Watson (W) and Crick (C) strands is also displayed. Raw sequencing reads are available at NCBI GEO39 under accession GSE61464. The proportion of 2.5 kb windows containing an observed number of rNMPs was calculated for nuclear (b) and mitochondrial (c) genomes and compared to random expectation based on Poisson frequencies. The P values calculated from chi-square goodness of fit test are shown (n = 10,847 and 3,347 for nuclear and mitochondrial, respectively). (d) Chromosomal distribution of rNMPs is compared to the size of each nuclear chromosome.

