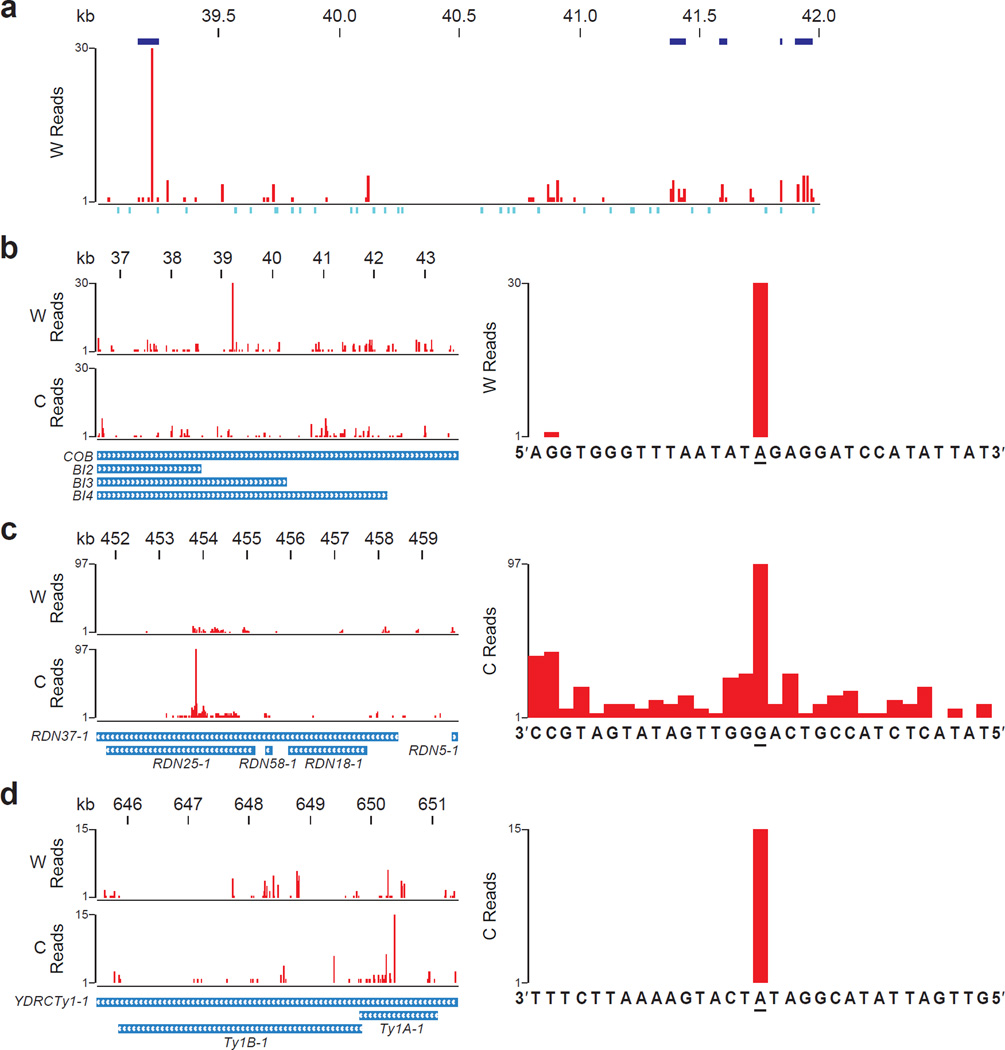
Figure 4. Hotspots of rNMP incorporation within S. cerevisiae mitochondrial DNA, rDNA repeat, and Ty1.
(a) Ribose-seq map of rNMPs in a 3 kb window (39,001–42,000) of mitochondrial DNA showing enriched regions of rNMP incorporation. W, Watson strand. Enriched regions with q-value < 0.001 are shown in blue above the plot. See Supplementary Data for all enriched regions. Positions of restriction sites used for genomic fragmentation are displayed below the plot in turquoise. (b) Map of rNMPs in COB mitochondrial locus (left).W, Watson, and C, Crick strand. Zoom-in map (right) with sequence at the hotspot site (underlined). (c) Map of rNMPs in the first of two rDNA repeat loci on Chr XII, based on alignment data from both loci of the reference genome (left). Zoom-in map (right) of the rDNA hotspot. (d) Map of rNMPs in the Ty1 locus YDRCTy11 on Chr IV based on multiple-alignment data from several Ty1 loci (left). Zoom-in map (right) of the Ty1 hotspot. Results are shown for rnh201Δ (KK-100) cells.

