
Figure 1. Tonic optogenetic stimulation of thalamic reticular neurons produces local cortical slow waves.
(a) Diagram of surgery: fiber is implanted into left TRN, and stereotrodes are implanted in multiple sites across cortex. (b) Spectrogram showing average effect in ipsilateral somatosensory cortex across 168 trials (4 mice): TRN stimulation causes a rapid increase in delta (1–4 Hz) power that persists throughout the stimulation period. Power is normalized to the 30 s pre-stimulus period. (c) Average spectrum of LFP in somatosensory cortex: during tonic optogenetic activation of TRN, this cortical site demonstrates an increase in delta (1–4 Hz) power and a decrease in beta and gamma (12–50 Hz) power. Gray region shows zoomed-in plot of delta power increase. (d) Example trace from a single trial, showing the LFP filtered between 1–4 Hz (black line), and the instantaneous delta amplitude (red line). (e and f) Circles represent single electrodes, and their color indicates the size of the delta (1–4 Hz) power increase when laser is on (total n = 136 trials, 4 mice, 12– 14 electrodes per mouse). At low powers (<2 mW), slow waves are induced only in electrodes near ipsilateral somatosensory cortex (red dashed circle). At high powers (>2 mW) that activate larger regions of TRN, slow waves appear across multiple cortical areas, including frontal cortex and contralateral cortex (red dashed circle). Distances are jittered so that electrodes from all mice can be displayed in a single schematic. Blue ‘X’ indicates placement of laser fiber. (g) Example spectra from one mouse at low laser power in electrodes ipsilateral and contralateral to the laser fiber (n = 10 trials): slow waves are induced in ipsilateral cortex but not in contralateral cortex. (h) Example spectra from same mouse at high laser power (n = 9 trials): slow waves are generated in both ipsilateral and contralateral cortex.

Figure 1—figure supplement 1. Selective TRN stimulation causes the induction of cortical slow waves.

Figure 1—figure supplement 2. Example of VGAT-ChR2 mouse histology at 10x.

Figure 1—figure supplement 3. Spectra of cortical LFPs recorded in VGAT-Cre mice expressing ChR2 selectively in TRN through local injections.

Figure 1—figure supplement 4. Normalized spectrogram recorded in VGAT-Cre mice expressing ChR2 selectively in TRN through local injections.

Figure 1—figure supplement 5. After viral injections, ChR2 expresses selectively in TRN.
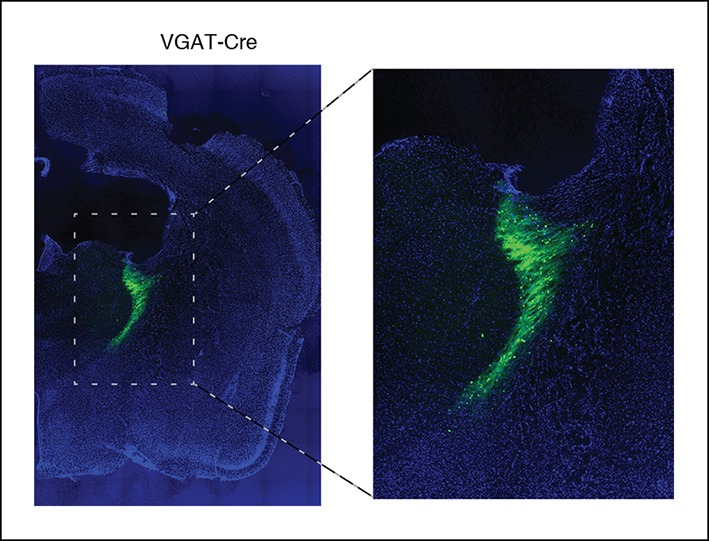
Figure 1—figure supplement 6. Slow wave induction depends on ChR2 expression.

Figure 1—figure supplement 7. Simulation of light transmission through tissue at different laser powers.

Figure 1—figure supplement 8. Phase offsets across cortex during TRN stimulation.

Figure 1—figure supplement 9. Phase offsets across cortex are not correlated with distance to the electrode.
