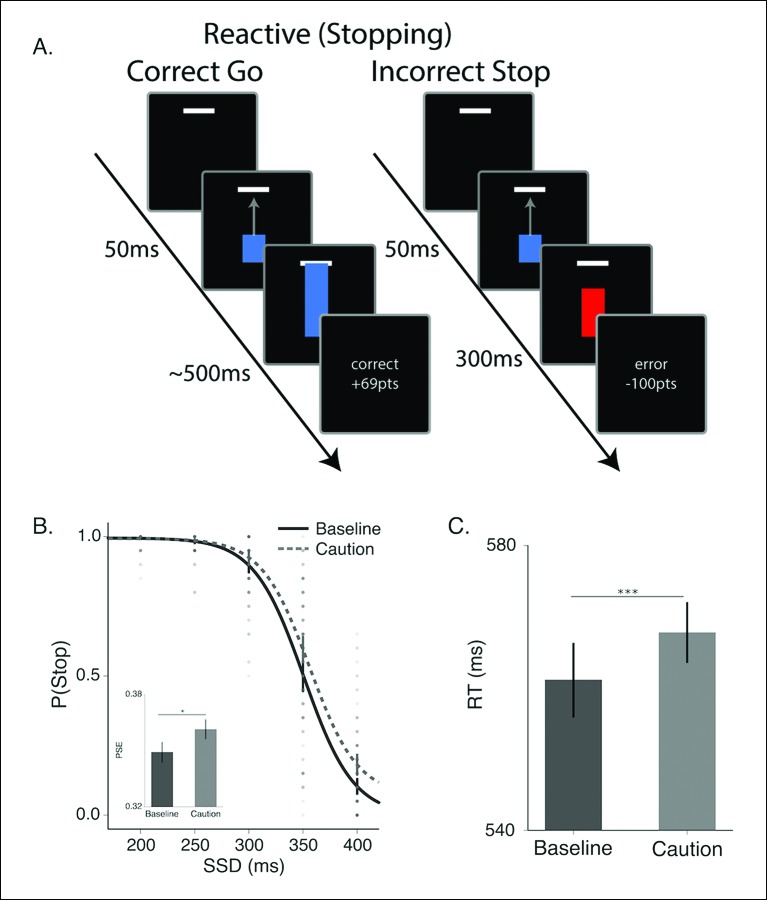
Figure 2. Reactive stopping task and behavioral results.
(A) Timeline of a go (left) and stop trial (right) in the reactive experiment. (B) Mean observed probability of stopping in the baseline (dark, solid) and caution (light, dotted) conditions; dots reflect individual subject means. As the stop-signal delay (SSD) increased, the probability of correctly stopping decreased. Inset in B shows the mean point of subjective equality (PSE) for both conditions. (C) Mean response times (RT) for the baseline and caution conditions. All error bars reflect the 95% confidence interval, * indicates p <0.05, *** indicates p <0.001.

