. 2015 Sep 24;4:e08723. doi: 10.7554/eLife.08723

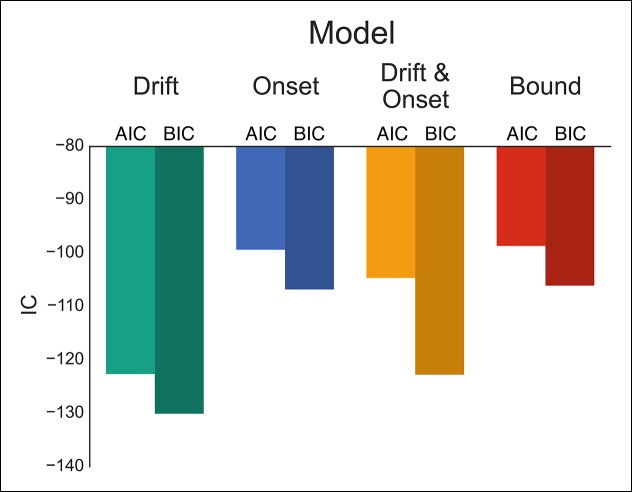
Figure 6. Comparison of modulation models in proactive task.

Goodness-of-fit measures for execution process modulation models in proactive task. Same plotting conventions as in Figure 4. As with the reactive experiment, the drift modulation model provided better fits to the proactive task data than the other models.

DOI: http://dx.doi.org/10.7554/eLife.08723.011

Figure 6.

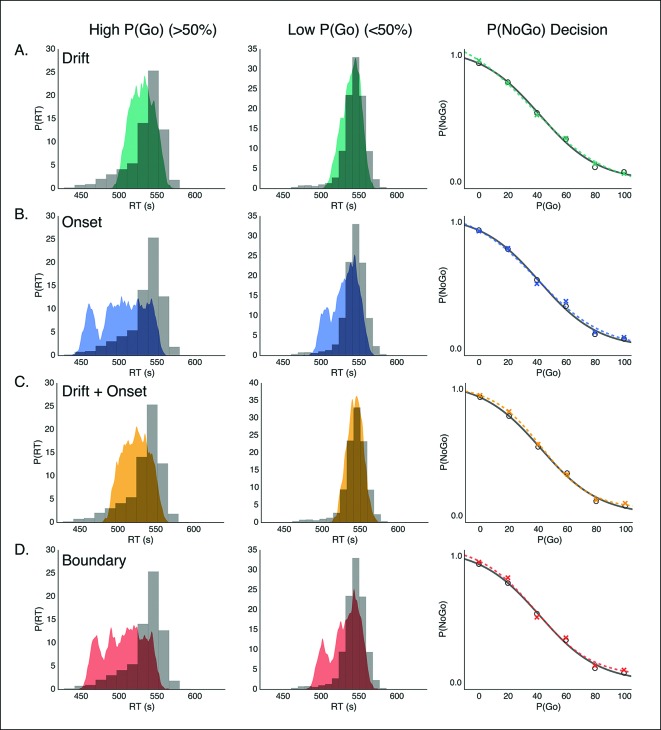
Figure 6—figure supplement 1. Model predictions of behavior in proactive task.

Figure 6—figure supplement 1.

Predicted RT distributions and no-go probability curves in the proactive task for the drift modulation (green, A), onset modulation (blue, B), onset and drift modulation (yellow, C), and boundary modulation models (red, D). Empirical (gray) and kernel density estimates (same conventions as in Figure 4) for the RT distributions are shown for the high and low go trial probability conditions in the left and middle columns, respectively. Right column shows no-go probability curves for each go trial probability condition.