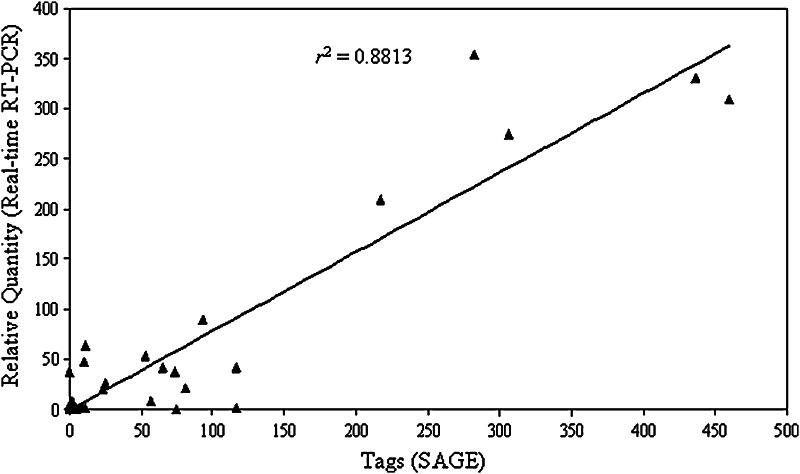
Fig. 4.
The quantities of eight gene tags measured directly by SAGE are shown in the x-axis after normalization (tags/50,000 tags). The fold difference of mRNA expressions as measured by TaqMan® real-time RT-PCR is shown in the y-axis using predesigned primers and probes (Applied Biosystems). The genes were validated included inhibin β A, CTGF, IGFBP7 (IGFBPrP1), p63, IGFBP6, IGFBP4, and IGFBP3. The correlation coefficient between these two methods is calculated as r2 = 0.8813.

