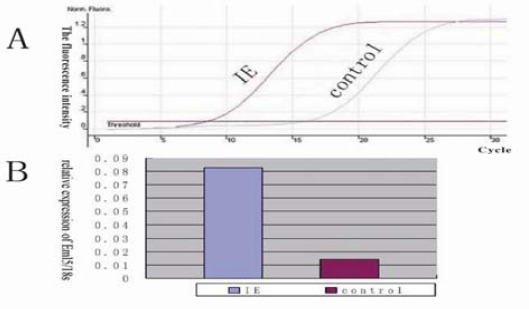
Figure 1.

FQ-PCR analysis of EML5 mRNA in the anterior temporal lobe of IE and control patients. (A) SYBR fluorescence amplification curve; (B) The relative expression of EML5 mRNA in IE patients was higher than that in the control (greater than a five-fold change)
